Section 1: Company Overview and Fundamentals
1.1 Company Overview:
GoPro, Inc. produces cameras, and mountable and wearable accessories. The Company offers a family of cameras, including its cloud connected HERO10 Black, HERO9 Black, HERO8 Black and MAX cameras. Its HERO10 Black camera offers 5,300 pixels (5.3K) video at 60 frames per second, HERO9 Black camera offers 5K video at 30 frames per second, and HERO8 Black camera can shoot video in 4K at 60 frames per second.
Kalkine’s Diversified Opportunities Report covers the Company Overview, Key positives & negatives, Investment summary, Key investment metrics, Top 10 shareholding, Business updates and insights into company recent financial results, Key Risks & Outlook, Price performance and technical summary, Target Price, and Recommendation on the stock.
Stock Performance:
- The stock has corrected by 38.75% in the last six months as well as by 52.64% in the last year.
- The stock is leaning towards its lower band of its 52-week range of USD 6.57 and 52-week low price of USD 2.54. Post the announcement of Q2FY23 results the stock corrected by 37.03% due to lower than expected earnings and financials.
- The price is currently trading below both its long-term (200-day) SMA and its short-term (50-day) SMA , with the current RSI of oversold 28.05.
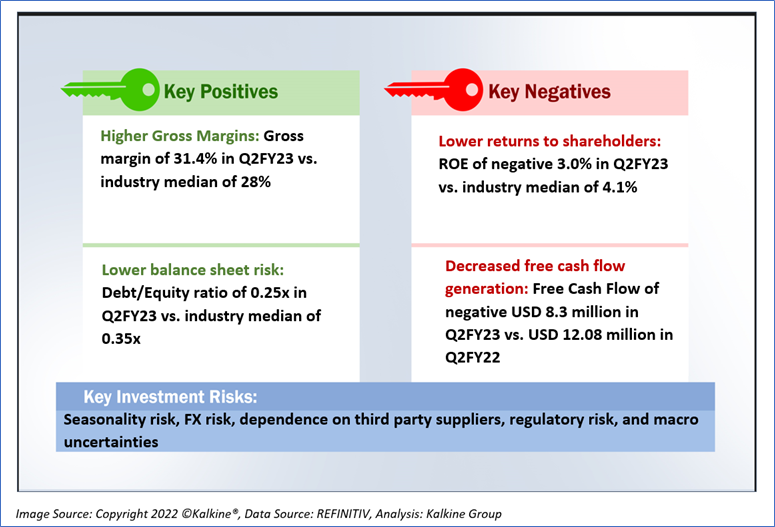
1.1 The Key Positives, Negatives, and Investment summary
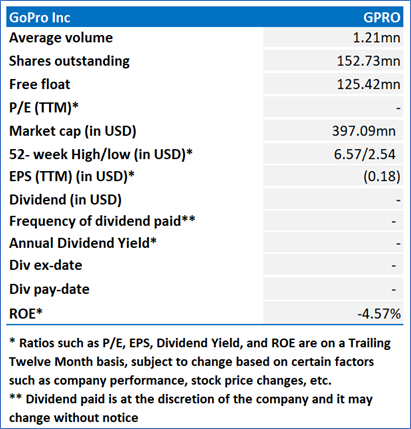
1.3 Key Metrics:
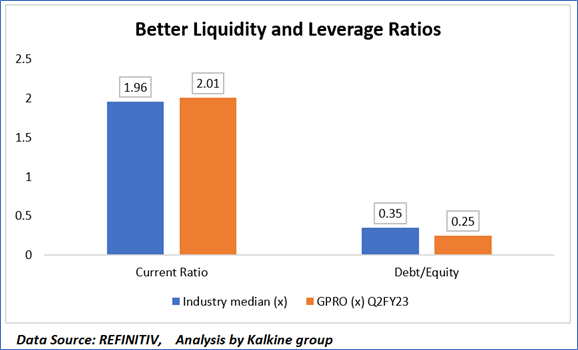
The superior short-term liquidity of GPRO suggests that the company is well prepared to meet its immediate financial obligations, potentially indicating efficient cash management. Additionally, the smaller debt-to-equity ratio compared to competitors reflects a more conservative approach to financing, reducing the risk associated with excessive debt burden. This strong financial footing could provide GPRO with greater flexibility for strategic investments, expansion, or weathering economic downturns. Overall, these favorable financial indicators position GPRO in a favorable competitive stance within its industry.
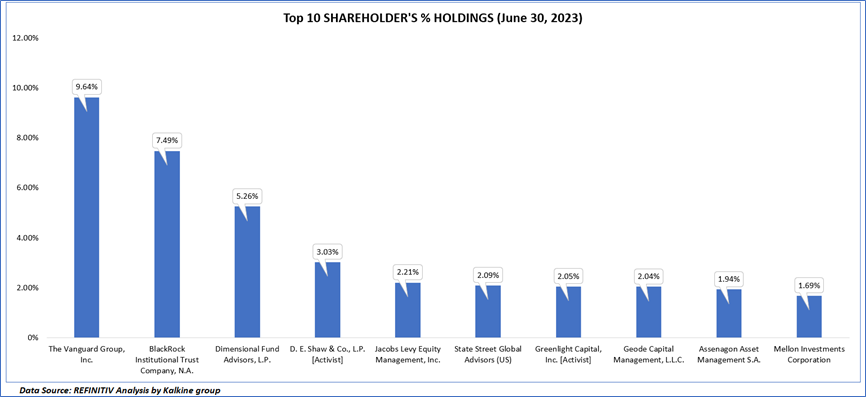
1.4 Top 10 shareholders:
The top 10 shareholders together form ~37.44% of the total shareholding, signifying diverse shareholding. The Vanguard Group, Inc, and BlackRock Institutional Trust Company, N.A. are the biggest shareholders, holding the maximum stake in the company at ~9.64% and ~7.49%, respectively.
Section 2: Business Updates and Corporate Business Highlights
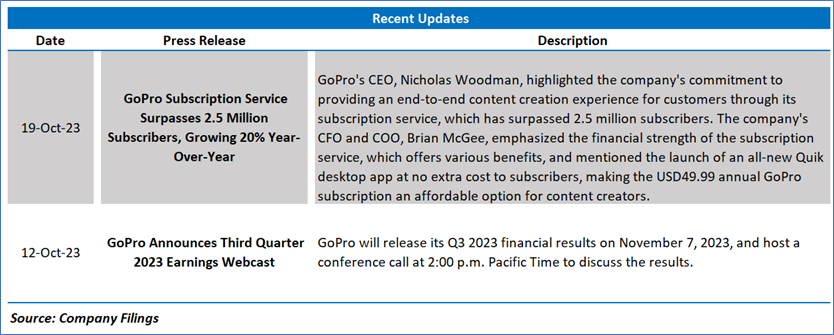
2.1 Recent Updates:
The below picture gives an overview of the recent updates:
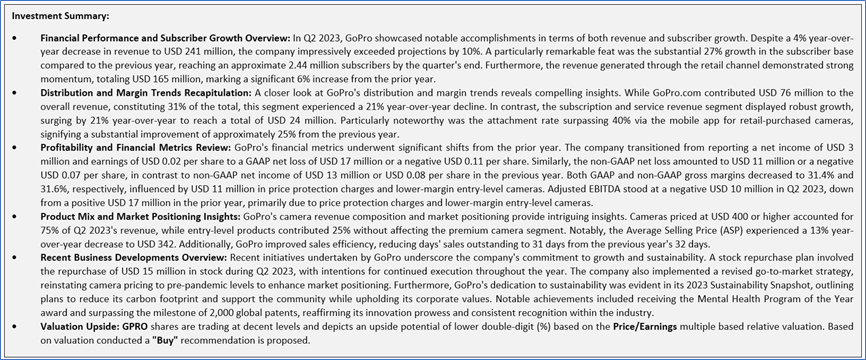
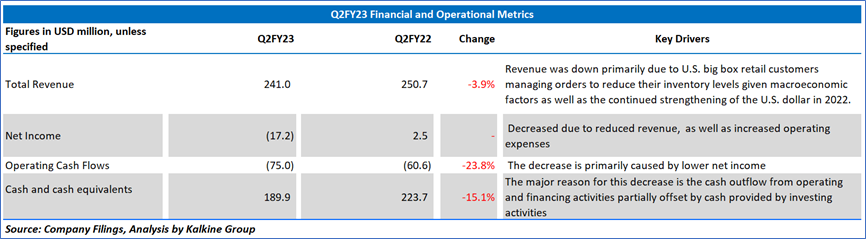
2.2 Insights of Q2FY23:
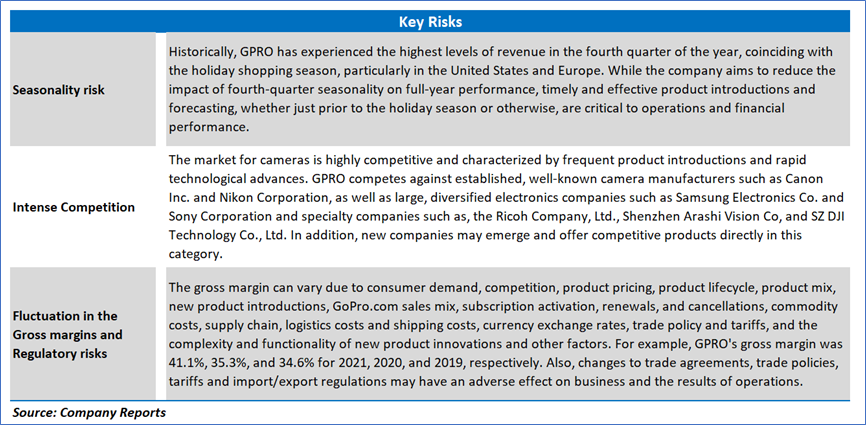
Section 3: Key Risks
Section 4: Stock Recommendation Summary:
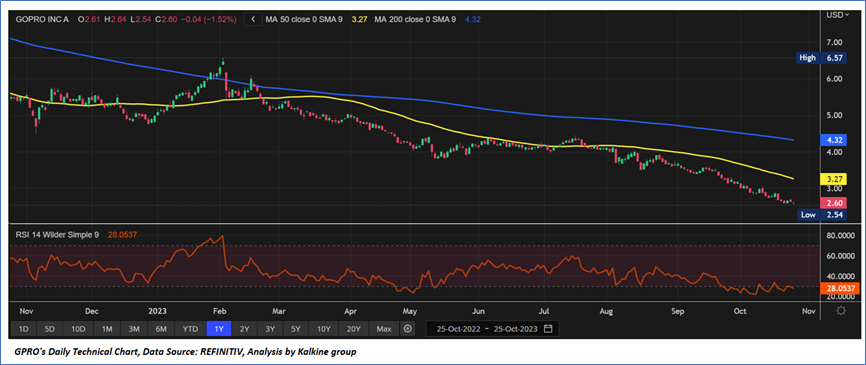
4.1 Price Performance and Technical Summary:
Stock Performance:
- The stock has corrected by 38.75% in the last six months as well as by 52.64% in the last year.
- The stock is leaning towards its lower band of its 52-week range of USD 6.57 and 52-week low price of USD 2.54. Post the announcement of Q2FY23 results the stock corrected by 37.03% due to lower than expected earnings and financials.
- The price is currently trading below both its long-term (200-day) SMA and its short-term (50-day) SMA , with the current RSI of oversold 28.05.
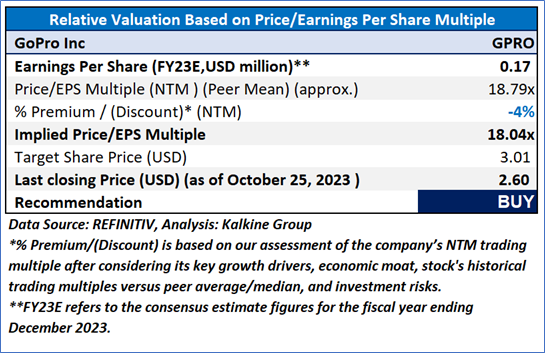
4.2 Fundamental Valuation
Valuation Methodology: Price/Earnings per share Multiple Based Relative Valuation
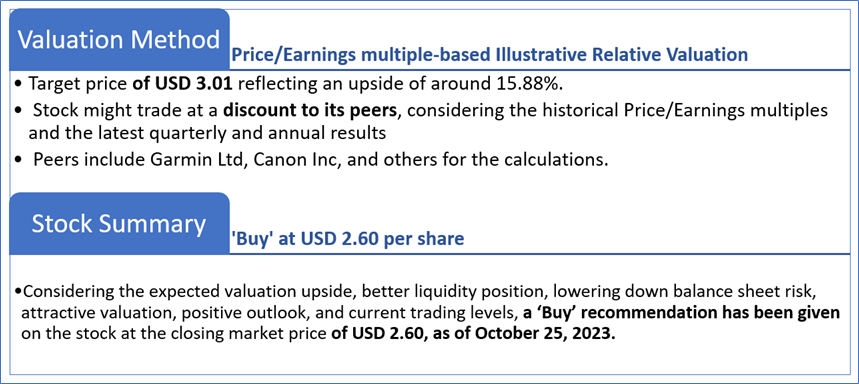
Markets are trading in a highly volatile zone currently due to certain macroeconomic issues and geopolitical tensions prevailing. Therefore, it is prudent to follow a cautious approach while investing.
Note 1: Past performance is not a reliable indicator of future performance.
Note 2: The reference date for all price data, currency, technical indicators, support, and resistance levels is October 25, 2023. The reference data in this report has been partly sourced from REFINITIV.
Note 3: Investment decisions should be made depending on an individual's appetite for upside potential, risks, holding duration, and any previous holdings. An 'Exit' from the stock can be considered if the Target Price mentioned as per the Valuation and or the technical levels provided has been achieved and is subject to the factors discussed above.
Note 4: The report publishing date is as per the Pacific Time Zone.
Technical Indicators Defined: -
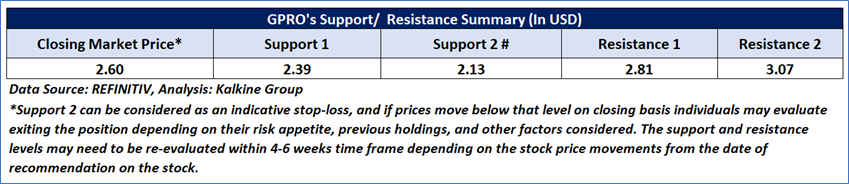
Support: A level at which the stock prices tend to find support if they are falling, and a downtrend may take a pause backed by demand or buying interest. Support 1 refers to the nearby support level for the stock and if the price breaches the level, then Support 2 may act as the crucial support level for the stock.
Resistance: A level at which the stock prices tend to find resistance when they are rising, and an uptrend may take a pause due to profit booking or selling interest. Resistance 1 refers to the nearby resistance level for the stock and if the price surpasses the level, then Resistance 2 may act as the crucial resistance level for the stock.
Stop-loss: It is a level to protect against further losses in case of unfavorable movement in the stock prices.
Disclaimer
References to ‘Kalkine’, ‘we’, ‘our’ and ‘us’ refer to Kalkine Limited.
This website is a service of Kalkine Limited. Kalkine Limited is a private limited company, incorporated in England and Wales with registration number 07903332. Kalkine Limited is authorised and regulated by the Financial Conduct Authority under reference number 579414.
The article has been prepared for informational purposes only and is not intended to be used as a complete source of information on any particular company. No advice or information, whether oral or written, obtained by you from Kalkine or through or from the service shall create any warranty not expressly stated. Kalkine does not intend to exclude any liability which it is not permitted to exclude under applicable law or regulation.
Kalkine does not offer financial advice based upon your personal financial situation or goals, and we shall NOT be held liable for any investment or trading losses you may incur by using the opinions expressed in our publications, market updates, news alerts and corporate profiles. Kalkine does not intend to exclude any liability which it is not permitted to exclude under applicable law or regulation. Kalkine’s non-personalised advice does not in any way endorse or recommend individuals, investment products or services for your personal financial situation. You should discuss your portfolios and the risk tolerance level appropriate for your personal financial situation, with a professional authorised financial planner and adviser. You should be aware that the value of any investment and the income from it can go down as well as up and you may not get back the amount invested.
Kalkine Media Limited, an affiliate of Kalkine Limited, may have received, or be entitled to receive, financial consideration in connection with providing information about certain entity(s) covered on its website.
Past performance is not a reliable indicator of future performance.

 Please wait processing your request...