Definition – Frequency Distribution
A frequency distribution could be defined as a graphical or tabular display of data that summarise the data into a relatively small number of intervals. Ideally, a frequency distribution is a statistical tool that helps in analysing large amounts of data while working with all types of measurement scale.
Steps to Construct a Frequency Distribution
As a tool to summarise a vast amount of data, frequency distribution follows some basic steps, which are as below:
- Arrange or sort the data in ascending order.
- Calculate range, which is defined as the difference between the maximum and minimum value of the underlying data.
- Decide the number of intervals.
- Determine the width of the interval.
- Determine successive intervals by adding the interval width to the minimum value.
- Terminate the above step after reaching the interval containing the maximum value.
- Identify the number of observations falling into each interval.
While each step sounds very easy to perform, except arranging the data in ascending order, other steps are usually more complicated than they sound and involves a lot of understanding and precautions.
Terminology and Concepts Related to Frequency Distribution
- Interval
An interval is defined as a set of values within which each observation in a frequency distribution falls; thus, intervals group data in a frequency distribution. Also, as each observation of a data set falls into only one interval, the total number of interval covers all observations in a data set.
- Frequency or Absolute Frequency
The total number of observations falling into a given interval is described as frequency or absolute frequency.
- Relative Frequency
The relative frequency could be defined as the ratio of each observation relative to the total number of observations.
- Cumulative Relative Frequency
Cumulative relative frequency basically cumulates or adds up the relative frequency as we move from top to bottom of the frequency distribution table.
The cumulative relative frequency identifies what fraction of observation is less than the upper limit of the interval in frequency distribution and is a great summarisation tool.
Constructing a Frequency Distribution
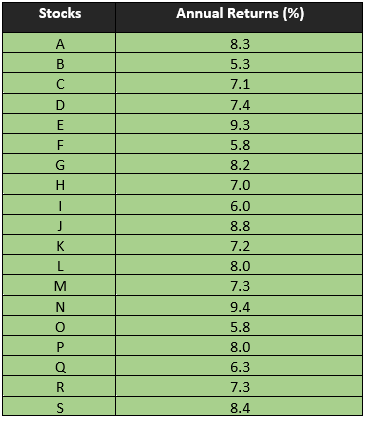
To construct a frequency distribution table, let us take a hypothetical portfolio of stocks with annual returns as mentioned in the below table:
To summarise the above-presented data in a frequency distribution, we need to follow the steps of constructing a frequency distribution table.

Step 1
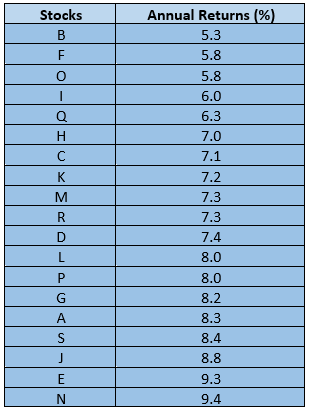
Arrange the annual returns in ascending order.

Step 2
Determine the range by taking the difference between the maximum value and the minimum value.
So, the range for our data table would be

However, as the difference between the maximum value and the minimum value is ending into a rational number, we would convert the range into a positive integer by rounding. Furthermore, it is often advisable to round the range to the upper side rather than the lower side to capture the maximum value of the data into a frequency distribution.
Thus, let us take 5 as the number of range for constructing a frequency distribution of the above-presented portfolio.
Step 3
Determine the number of intervals
For simplicity, let us try to summarise the annual returns of each stock present in the portfolio into 5 intervals.
Step 4
Determine the interval width by dividing the range of the data with the number of intervals.

Thus, the interval width for our data set would be

Step 5
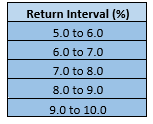
Determine the interval by successively adding the interval width to the minimum value, leading to the interval table as below:

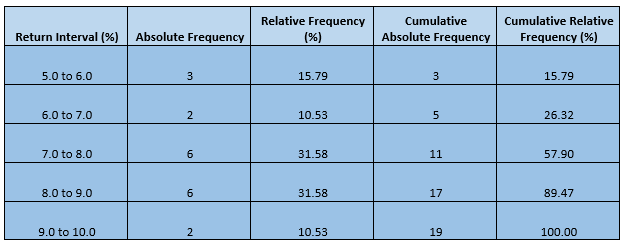
Once we have the interval table, we can move ahead with the construction of a frequency distribution by finding individual components of a frequency distribution such as frequency, relative frequency, cumulative frequency, and cumulative relative frequency.

Interpreting the Frequency Distribution
In a frequency distribution table, an absolute frequency tells the number of observation falling into each interval and could address some questions like how many stocks delivered an annual return of greater than five per cent but less than 6 per cent and so on.
Likewise, relative frequency tells what fraction of observation falls into each interval and could address questions like what fractions of stock delivered a return higher than the expected range.
For example, if someone asks what fraction of the portfolio delivered a return between 8.0 to 9.0 per cent, the answer is just summarised in the face of absolute frequency, i.e., 31.58 per cent.
Apart from these two, cumulative relative frequency is also a great tool to summarise a data set, that tells what fraction of observation is less than the upper limit of the interval, and it can answer questions like percentage of stock delivering less than 9.0 per cent annual return in the above hypothetical portfolio.
I.e., 89.47 per cent.
Also, in the context of investment, frequency distribution could also serve as a first insight to determine the expected return on a portfolio or any individual stock by summarising the historical return.
For example, as the above-constructed frequency distribution table of our hypothetical portfolio reflects that nearly one-third of the observation falls between the interval of 7.0 to 8.0 per cent and nearly one-third of observation falls between the interval of 8.0 to 9.0 per cent; thus, a return between 7.0 to 9.0 per cent could be expected from the portfolio in the future, considering the historical performance.
However, in such a context, many other parameters need to be considered. For example, each stock in the portfolio should have an equal weightage to reach the determined expected return. Likewise, it should also be noticed that in the future context, frequency distribution only gives a vague idea as it is mainly a tool which summarises the actual past data.
 Please wait processing your request...