What is the Law of Demand?
Law of demand states that the price of a good is inversely proportional to the quantity demanded of that good. This means that as prices of a good falls, ceteris paribus, the quantity demanded of that good increases, and vice versa. This happens because as goods become cheaper, more and more people want to buy them.
Law of demand helps explain how the goods market moves. Through the demand and supply curve, the goods market equilibrium can be predicted. With the help of a demand curve, the demand of a good can be estimated given its price.
What is a Demand Curve?
A demand curve plots the prices of a good against the quantity demanded of that good. Each point in a demand curve represents a combination of price and quantity that is achievable for that good. A demand curve is made with the help of a demand schedule which is a table representing the quantity demanded against individual prices.
Demand curves are downward sloping because of the negative relationship between prices of a good and its quantity demanded. Its slope varies depending on the price elasticity of demand for the good in question.
Price elasticity of demand refers to the ratio of the percentage change in quantity demanded to the percentage change in price. As the price elasticity of demand for good increases, the slope of the demand curve decreases.

It is important to note that ‘demand’ and ‘quantity demanded’ are not the same.
Demand refers to the relationship between prices of a goods and its quantity demanded, whereas quantity demanded refers to the quantity associated with a particular point on a demand curve.
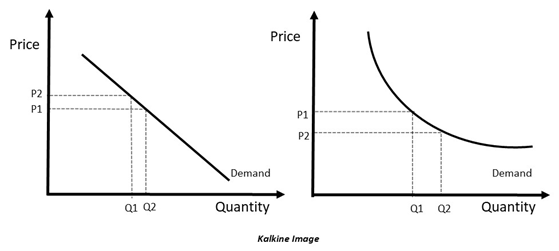
Demand curves have different shapes based on different price and quantity relationships. They can be concave or straight lines; however, they are always downward sloping.
How does the demand for a good change?
The quantity of a good may change due to various factors, prices being one of them. When the prices of a good increase, people start to consume less of that good, unless that good is a necessity good. A necessity good is a type of good that cannot be removed from the consumption basket of people, even if its prices are rising. An example of this can be oil, bread and utilities like power and water.
Alternatively, the demand for a good can be influenced through various other factors like income, price of related goods, taste and preferences of the consumer and the number of consumers in the market.
Here, related goods refer to substitute and complementary goods. Substitute good is an alternative good that can be used to replace the good in question, while a complimentary good refers to another good that must be purchased along with the good in question to use it.
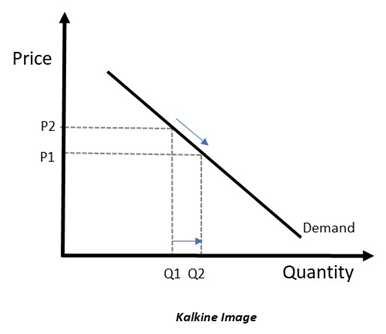
Keeping all other factors equal, when the price of a good changes, the change in demand curve is observed along the curve, as shown below:

Here, the negative relationship between price and quantity demanded is visible. As prices fall from P1 to P2, the quantity demanded increases from Q1 to Q2.
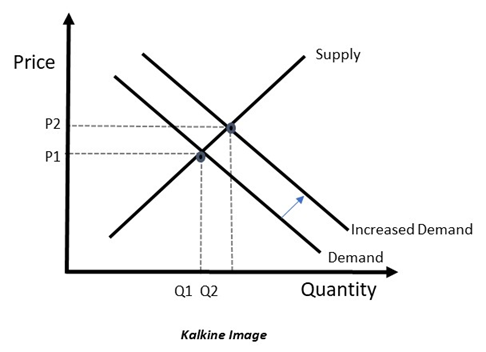
When factors other than price are changed, then the change in the demand curve is observed through a shift and not through a movement along the curve. In this case each factor is changed separately while all other factors are kept constant.

In the figure above, when prices are kept constant, the demand curve shifts due to changes in one of the determinants of demand other than price. However, this change ultimately leads to a corresponding change in the price.
In the scenario shown above, both price and quantity demanded are increasing. This does not mean that the law of demand is failing here. The prices have adjusted to the shift in the demand curve. As the quantity demanded shifts from Q1 to Q2, the limited supply of that good makes the prices rise. Thus, the law of demand works with law of supply to find out various allocation levels of a good in a market.
Why is there a negative relationship between the price of a good and its quantity demanded?
The relationship between the price and quantity of a good is given by the Law of Demand. This relationship exists because individuals in an economy are assumed to be rational. This means that they would want to incur as less costs as possible and gain as much profit as possible from a transaction.
This rationality explains why consumers would want to save up on their costs while purchasing a good. Therefore, when price drops for a commodity, most individuals would flock to the stores to buy that commodity, sometimes even irrespective of other factors like their tastes or preferences.
For instance, consider the scenario where there is sale on appliances of Company A. Most consumers would start purchasing the goods of Company A, even if they had previously been consuming appliances from another company.
Sometimes, people would shift to goods that were previously out of budget for them, simply because of a reduction in prices. For instance, consider an individual who does not own a car because he cannot afford it and depends on public transport instead. However, seeing a temporary dip in the prices of automobiles, he might purchase a car now than wait for him to be able to afford it in the future.
This knowledge of price and demand relationship is used by governments and monetary authorities to influence the business cycles. Prices can be raised to reduce demand by the government and can be decreased to encourage consumption of goods in the economy.
What are some cases where law of demand does not apply?
Law of demand may not apply for certain specific categories of goods. These include Giffen goods and Veblen goods.
Giffen goods refer those goods which see an increase in quantity demanded as their price increases. They are certain exceptional types of goods that form a large part of an individual’s consumption basket and lack close substitutes. An example of this can be essential items like bread. As the price of bread rises, people start hoarding more of it.
Veblen goods are the luxury goods that see increased demand as their prices increase. People attach a sense of social status to these luxury goods, which is why they buy more of that good as it becomes expensive.
 Please wait processing your request...