OPEC basket, also known as the OPEC reference basket, is a weighted average of oil prices from selected 13 oil-exporting developing nations, also known as OPEC member countries. It is used as a critical crude oil benchmark to track the trend, stability, and oil prices. The basket holds a variety of crude, ranging from light to heavy, from various OPEC member countries.
OPEC refers to the Organisation of the Petroleum Exporting Countries. It is an intergovernmental association, which came into existence in September 1960 at the Baghdad Conference. The association was founded by five countries which were later joined by 11 additional nations. The target of the organisation is to facilitate and normalise the oil policies in member nations & balancing out oil costs in the worldwide market, protecting the smooth channelisation of oil from explorers to oil shoppers.
OPEC Basket Members
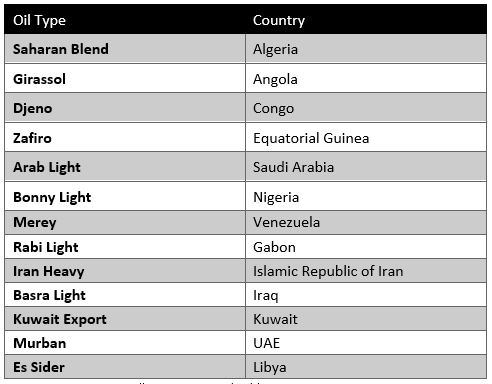
At present, the OPEC reference basket comprises member countries -- Iran, Iraq, Kuwait, Saudi Arabia, UAE, Algeria, Congo, Equatorial Guinea, Angola, Venezuela, Libya, Nigeria, and Gabon. Numerous nations all over the world also produce oil, but they are independent and are not the OPEC members. Russia, the US, China, and Canada are the four most significant oil producers who are not the OPEC members.
The OPEC Reference Basket of crudes

Kalkine Constructed Table, Source: Opec.org
OPEC Market Share
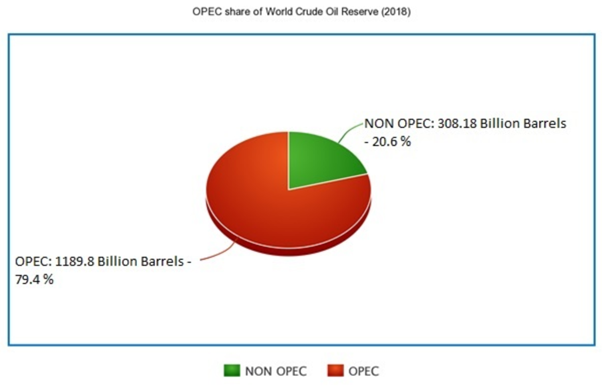
According to OPEC Share of World Crude Oil Reserves 2018, the OPEC members host around 79.4% of world's proven oil reserves with about 64.5% of them situated in the Middle East. The net expansion in total production during 2009-2018 by the Non-OPEC nations was 24.6 billion barrels. Conversely, it was 186.2 billion barrels for the OPEC nations.

Kalkine Constructed Image, Source: Opec.org
Prices of OPEC Reference Basket oils 2002-2020
From 2002 to 2019, costs of the OPEC Reference Basket oils varied significantly. For instance, Saharan Blend from Algeria remained at about US$25 per barrel in 2002. After 10 years, this figure had expanded to over US$111, before diminishing to US$64.49 in 2019.
Plummeting prices and recovery
Prices started to increase from the 2008 worldwide financial crisis and reached on top in 2012, preceding a significant decline. In 2014, the average annual price of the OPEC crude oil dropped by almost half due to surplus supply of crude oil in the market. From then, recovery has been progressive. However, the OPEC prices are not expected to go back to the levels of the initial 2010s in the next two decades.
Shale oil overproduction
The 2010s’ oil excess was caused to some extent due to the upgraded production of domestic heightening shale and tight oil in the United States. It happened after the improvement of pressure-driven hydraulic fracturing as an extraction technique in the wake of the worldwide downturn. Despite the fact that almost 80% of global oil stores are found in the OPEC nations, the United States has become the biggest producer of oil globally in last 10 years.
 Please wait processing your request...