What is Service PMI?
The Service Purchasing Managers' Index refers to the economic index, which is based on the survey of 400 and more services companies’ supply executives and purchasing managers. The survey is conducted by Institute of Supply Management (ISM) and the report gives direction to business leaders, government officials, supply management professionals and economists, which mainly covers the nation’s economic conditions. The Purchasing Managers' Index defined as the pressure indicator on a nation’s overall economy through presenting the economic trends in the service sector and manufacturing sector as well.
Summary
- The Service Purchasing Managers' Index refers to the economic index based on the survey of 400 and more services companies’ supply executive and purchasing managers.
- The Services purchasing managers’ index is also known as ISM non-manufacturing index.
- The survey is conducted by the Institute of Supply Management (ISM) and the report gives direction to business leaders, government officials, supply management professionals and economists on a nation’s economic conditions.
Copyright © 2021 Kalkine Media
Understanding Service PMI
The services purchasing managers’ index, is also known as ISM non-manufacturing index, is composed and provided by the Institute of Supply Management. The index is based on the data recorded from a survey of services companies. Contrarily, the Manufacturing purchasing managers’ index is used to find the level of output and activity of production in an economy including inventory or commodity purchase for the production of the goods.

Copyright © 2021 Kalkine Media
The Services purchasing managers’ index is announced in the first week of every month and it gives detailed information of the US economy from a standpoint of service sector. The services purchasing managers’ index provides a thorough monthly report. The data used is the index is not very explosive. The economic trends can continue for months, which is very precious for the analysts whose focal point is on doing long term economic forecasting. By observing the Services purchasing managers’ index investors can understand the trends and conditions of an economy much better within the US.
The services purchasing managers’ index gives significant details about the factors that affects total output, inflation, and growth. The index was introduced in corporation with the US Department of Commerce to estimate different activities in supply management.
The Services purchasing managers’ index surveys report include the activity of an economy of 15 and more industries including Finance and Insurance; Public Administration; Accommodation and Food Services; Retail Trade; Utilities; Arts, Entertainment, and Recreation; Real Estate, Rental, and Leasing; Agriculture, Forestry, Fishing, and Hunting; Wholesale Trade; Management of Companies and Support Services; Transportation and Warehousing; Educational Services; Professional, Scientific, and Technical Services; and Health Care and Social Assistance.
Frequently Asked Questions (FAQs)
What are the different components of Service PMI reports?
The ISM report of service purchasing managers’ index has various components that estimate the contraction or expansion of a business, and others that may be used in process of supply management. Here, some of the principal factors that include in the report are given below:
Business Activity: The services purchasing managers’ index report gives a whole idea about activity of a business in the US. The purchasing managers’ index is a count, where anything above 50 shows expansion. Anything lower shows contraction in business activity. The purchasing managers’ index report also shows the sectors that experienced expansion in the activity of business in the comparison of the previous month and indicates the contracted industries.

Source: Copyright © 2021 Kalkine Media
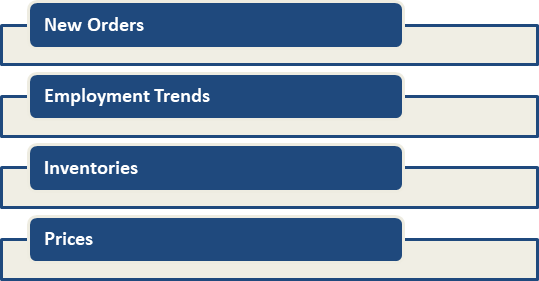
New Orders: New orders are also part of the ISM report of the index. It refers to the new sales recorded in compared to last month whether the business demand is rising or falling. New orders help investors to understand the flow of economic growth whether in increasing state or decreasing.
Employment Trends: In the service sector, employment trends or activity is calculated on a monthly basis. The Service PMI report represents whether employment contracted or grew every month by comparing the figures with preceding months. Therefore, the Service PMI report also gives an idea about the level of stiffness in the human resource market, it means the supply managers were able or not to fill the empty position as per the required qualification of applicants. If there are more vacant positions are available in the comparison of the applicants, it shows the growing or healthy economy and vice versa.
Inventories: In order to report rise and fall in an inventory level, the inventory level is tracked every month. The report on inventory levels may help an investor by giving the idea about the demand’s level for the services in specific industries, and it considers as a leading indicator to the strength of spending of a consumer in an economy. The rising level of spending of a consumer generally presents higher economic growth.
Prices: The services purchasing managers’ index report also shows that which of the industries reported a rise in the prices and paid for goods and raw materials. These paid prices may also include the prices paid for the services that the firms require, like the software services. These prices paid by the firms can be considered as inflation indicator that calculates how much prices went up in an economy. Higher prices indicate inflation and shortage in supply of certain goods.
 Please wait processing your request...