Technical analysis is the study of price actions which is based on one major assumption, i.e., freely traded markets travel in trend.

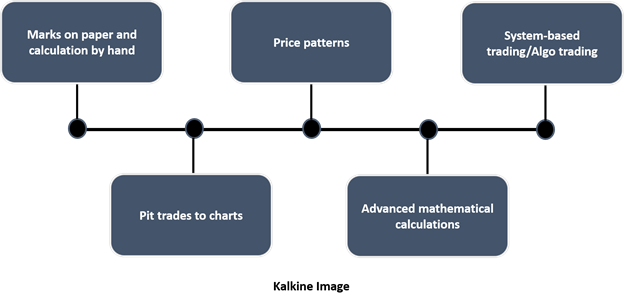
Centuries of work in interpreting and understanding the movement of prices in financial markets have seeded the field of technical analysis with a rhetoric change from marks on paper and calculation by hand, pit trades to charts, price patterns, advanced mathematical calculations, and system-based trading or Algo trading.
A lot of advancement has taken place in the way financial markets are traded, leading to a paradigm shift in how one now picks data, analyses it, and acts on it. The two famous methods for analysing the markets are technical analysis and the fundamental analysis.
Good read: Significance Of Fundamental Analysis
While fundamental analysis primarily considers economic cycles, macroeconomic and microeconomic data, industry data, and stock-specific data, the field of technical analysis primarily relies on historical price data to forecast the future direction of the security under consideration.
More on this, read: What Is Technical Analysis?
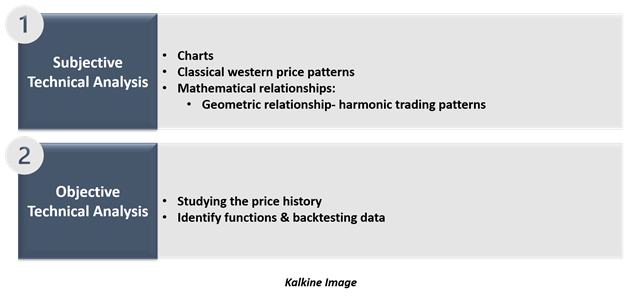
Centuries of work and observation along with the advancement of mathematical tools and computers have now divided the technical analysis into two subbranches, i.e., subjective technical analysis and objective technical analysis.

The subjective field deals with charts, classical western price patterns, mathematical relationships such as geometric relationship- as in harmonic trading patterns, while the objective field majorly deals in studying the price history, identify functions which explains and correlates the past price behaviour to a certain extent, and the backtesting those functions to test their performance on the historical data.
Despite a lot of advancement in the field, the primary goal of the field remains the same: identify the trend as early as possible, capitalise on it for as long as possible, and manage the risk along the way.
How Technical Analysts Make Money?
There are a lot of requirements to convert pure technical analysis into money, but the first and most important is to determine when a trend is beginning or ending. Then the money is eventually made by jumping on the trend as early as possible, which though may sound very simple theoretically, but could be really challenging in practice.
The introduction to technical analysis generally brings novice learners of the field into “trend analysis”, which is the stepping stone.
From a tactical standpoint, a technical analyst must decide on two things: when to enter the market and when to exit it; and choosing when to exit compose of two things, i.e., when to close a position to book profit when the trend moves in favour and when to book a loss and exit when it is moving against you.
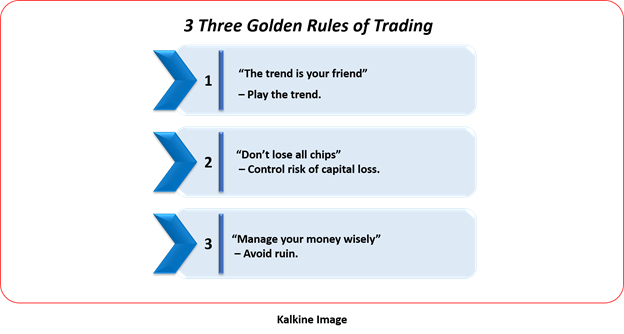
Three Golden Points to Abide by

Read: Buying the Dips – A Tapestry of Technical Tools and Strategy
Assumptions of Technical Analysis

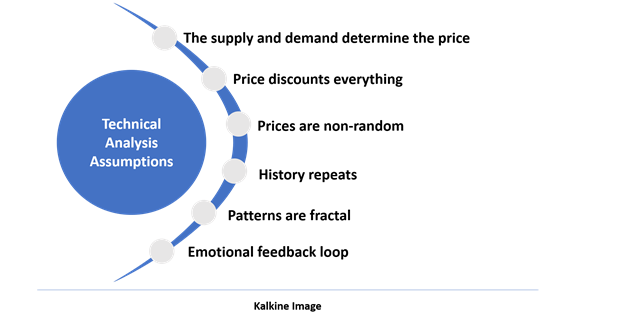
The market moves in trend is the basic principle of the underlying theory behind technical analysis, and to support this notion, technical analysts have made several other assumptions, which are as below:
- The supply and demand determine the price
As per the basic economic theory, price increases when demand exceeds supply, on the same lines technical analysts believe that the market forces, i.e., the cumulative effect of buying and selling determine prices.
Traders buy when they expect the underlying security to rise, and expectations emerge from human decisions – which are based on information, emotions – which emerges from the chemistry and electrical connections with our brains (a subfield of neurofinance), and cognitive limitations such as behavioural biases, from the school of Behavioural Economics.
Must read: Making Wrong Investment Decision? Blame Your Amygdala!
- Price discounts everything
Price, which is the result of the cumulative buying and selling, reflects all the available information in the public and private domain. The concept was first introduced and articulated by Charles H. Dow and was later emphasised by renowned technicians such as William Peter Hamilton in his Wall Street Journal editorials.
- Prices are non-random
This is an important corollary to the notion that market moves in trend, and of course, an object which moves randomly cannot be in a measurable cognitive trend.
- History repeats itself
The assumption is strongly based on psychological measurement that humans behave similarly to the way they have in the past under similar circumstances. The assumption leads to behaviour which further leads to trends which form into patterns.
Effects of human behaviour read: What does Fear Do to your Portfolio? Stocks that Scared Investors in 2019
- Patterns are fractal
Each investor or trader has a specific period of interest in which one operates, and interestingly, regardless of period, patterns occur with similar, although not identical, shapes and characteristic.
Also, this assumption points at the behaviour of patterns, i.e., they remain the same irrespective of the timeframe, as patterns are the result of human behaviour, which remains the same under similar circumstances.
So, it does not matter if a head & shoulder chart pattern has emerged on the daily timeframe, weekly timeframe, or a monthly timeframe, it would result in the same.
- Emotions are affected by earlier emotions through emotional feedback loop in human brains.
So if a trader buys a stock and the stock rises in price, the trader would share the information with the other and other would act the same on it, which is the reason, market bubbles emerge, and the above notion is the main logic behind the mean revision theory.
Dow Theory and History of Technical Analysis
Charles H. Dow, the father of modern technical analysis, was the founder of the Dow -Jones financial news service in New York and the first editor of the Wall Street Journal.
Charles Dow was the first to create an index that measures the overall price movement of the U.S. stocks and wrote editorials about what and how he had understood.
Charles Dow never formalised or documented what has become the basic foundation stone of modern technical analysis – The Dow Theory.
After his demises in 1929, William Perter Hamilton succeeded him as editor of the Wall Street Journal and continued writing the journal using the tenets of Charles Dow.
It was after Hamilton’s death in 1929, Robert Rhea, a renowned Dow theorist, collected and formulated what has today come to be known as the Dow Theory.
Rhea’s Hypothesis and Dow Theorems
Hypothesis
- The primary trend is inviolate.
- The average discounts everything.
- Dow theory is not infallible.
It could be seen that how using tenants of Dow, Robert Rhea could actually match assumptions of modern technical analysis, that is why the Dow Theory is considered as the foundation stone of the modern technical analysis.
Dow Theory Theorems
- The ideal market picture consists of an uptrend, top, downtrend and bottom, interspersed with retracements and consolidations.
From the modern standpoint of the “Efficient Market Hypothesis”, this ideal market picture is interesting as it presumes that price oscillates over long-period based on accumulated emotion of investors as well as the facts of the business and market cycles.
- An Economic rationale should be used to explain stock market action - (The Concept of Confirmation).
The idea behind the theorem is that two averages should always confirm each other, and if there is a divergence between them, the rise is a fluke and should be avoided.
For example, as in Dow’s journal, the DJIA and Railroad average should move in the same direction at the same time as both segments are economically connected.
- Price moves in trends
According to Dow theory, there are basically three types of trends, i.e., the primary trend, which always tends to continue rather than reverse (Rhea’s hypothesis – the primary trend is inviolate), the secondary trend, which is the reflection of the primary trend, and the minor trend, which is the reflection of the secondary trend.
 Please wait processing your request...