What is volatility?
In the stock market, volatility stands for the risk of change in the price of a security. High volatility is associated with higher risk. Generally, it is measured by calculating the standard deviation between the returns of a market index or security.
Summary
- Volatility stands for the risk of change in the price of a security.
- There are two types of volatility, implied (forward-looking) and historical volatility (also known as statistical volatility).
- Volatility is measured by calculating standard deviation, beta, or volatility index.
- Volatility is not associated with losses but with the risk.
Frequently Asked Questions (FAQs)
What is implied and historical volatility?
Implied Volatility (IV)
Implied volatility is forward-looking and suggests the volatility of the stock in the future. Chiefly, implied volatility indicates the probable movement of the security price in the market. It is calculated based on the variation in the prices of option contracts (derivatives). For example, if the premium on an option contract is rising then it is estimated that implied volatility is increasing. High volatility shows that security prices will move drastically either way (depreciate or appreciate). Similarly, low IV indicates that a drastic swing will not be observed in the security price.
Historical Volatility (HV)
As evident from the name, historical volatility stands for measuring volatility on the basis of the historical price movements. It is also known as statistical volatility because of the heavy reliance on statistical measures. High historical volatility implies that stock prices will show great fluctuation and vice versa. HV is not prevalent in the current market as it is not forward-looking like IV. In most of the cases, HV is calculated based on stock performance for the last 120 or 180 days.

How to measure volatility?
The following steps can be used to calculate volatility using Excel:
Step 1: Security’s daily closing prices should be gathered.
Step 2: Calculate the daily return by using function “LN” in excel

Step 3: Calculate standard deviation (daily volatility) by using function “STDEV” in excel
Step 4: To measure annual volatility, multiply daily volatility with the . Here, ‘t’ is time.
How to assess standard deviation?
In the context of the relationship between stock volatility and standard deviation – the higher the standard deviation implies higher volatility. In simpler terms, a higher value of standard deviation projects that the price of the stock can change drastically in either direction in a short span of time. Similarly, a low value of standard deviation indicates that stock prices will not change dramatically in a short span of time.
Zero volatility shows that stock prices are constant and generally, investors do not make any profits in long term from zero volatility. For stocks, volatility of 10% is assessed as very low volatility, 35% as not high volatility and 80% as very high volatility.
How to use beta for measuring volatility?
Beta indicates the change in the price of security against its benchmark index. For example, if a security has a beta of 0.5, then the stock price will not show a significant swing if the market index shows a high swing. Stocks with a beta higher than 1.0 are riskier, that is, they have high volatility.
Regression analysis is employed to calculate the beta value.

OR

How to use VIX for measuring volatility?
The volatility index takes into consideration the investor’s opinion and measures the implied volatility. It calculates the volatility of the market for the next 30 days. High VIX value projects high volatility market and vice versa holds true.
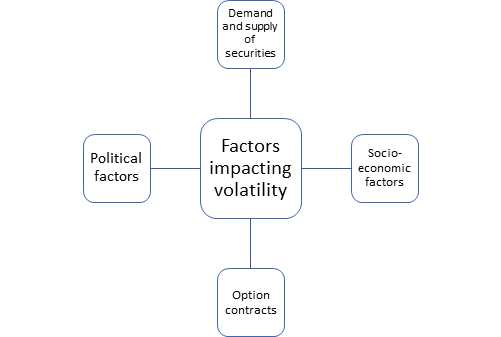
Which factors impact the volatility?
There are numerous factors that impact volatility.
- Demand and supply of the market securities
- Political factors.
- Socio-economic factors
- Options contracts – the expiration date of a contract.

Source: Copyright © 2021 Kalkine Media
How can investors take advantage of volatile markets?
Volatility should not be seen as a sign of incoming losses but as a scenario with risk. If harnessed correctly, experienced investors can generate returns. An investor can even take advantage when the market is fluctuating or crashing.
In the declining market, higher volatility is associated with higher profits. On other hand, in a rising market, lower volatility is associated with higher profitability. These facts should be considered by investor while creating market portfolio or regular trading.
How to use options for taking advantage of volatile markets?
By using options contracts, investors can hedge their position against the extreme market conditions and can make a profit from the large swing in the prices of securities. For example, if a stock has high volatility in bearish market, then the investor can buy put option and make a profit. Buying a put option gives right (not obligation) to the holder to sell the shares.
Moreover, strangle, straddle option strategies, futures contracts and volatile index options can be adopted by the investors or traders to generate profit from the highly volatile market index or securities.
What points to consider while trading in a volatile market?
To avoid exposure from the market risk, online brokers generally shift to a manual system for handling transactions from an automatic system. Trading in highly volatile market is different from normal day trading because of the following reasons:
- Delay: The execution of transactions can be delayed as the volume of trading is generally high in a volatile market. Therefore, the investor can observe a difference in the price quoted during conducting the transaction and the price at which the transaction is executed.
- Different platforms for executing transactions: Since the volume of transactions is heavy during a volatile market, the system might not be able to respond due to its limited capacity. So, traders usually use phones (talk to brokers) for executing transactions.
- Price quotes: There can be a significant difference between the price quoted and the price at which transaction is executed. Moreover, in many cases, the size of the quote can also change significantly.
 Please wait processing your request...