
Safestore Holdings PLC (LSE: SAFE): is an FTSE 250 index-listed, SAFE is the UK's largest and Europe's second-largest provider of self-storage. The company operates approximately 190 stores, including 133 wholly-owned stores in the United Kingdom. Among these, 73 are located in London and the Southeast, with the remaining stores situated in metropolitan areas such as Manchester, Birmingham, Glasgow, Edinburgh, Liverpool, Sheffield, Leeds, Newcastle, and Bristol. Additionally, SAFE has a presence in Paris, France, Spain, and the Benelux region, including the Netherlands and Belgium.
The company's top-line revenue grew marginally, around 5.5% YoY during FY23, while its Underlying EBITDA rose approximately 3.3% during the same period. Additionally, the company has added 500,000 sq. ft of new Maximum Lettable Area across thirteen projects in FY23. With £200 million of headroom under the RCF plus a £100 million accordion facility, the company maintains adequate liquidity. Moreover, SAFE is carrying around 73% of debt at fixed interest rates with tenors from 2024 to 2033. Overall, the company aims to generate returns significantly ahead of its cost of capital.
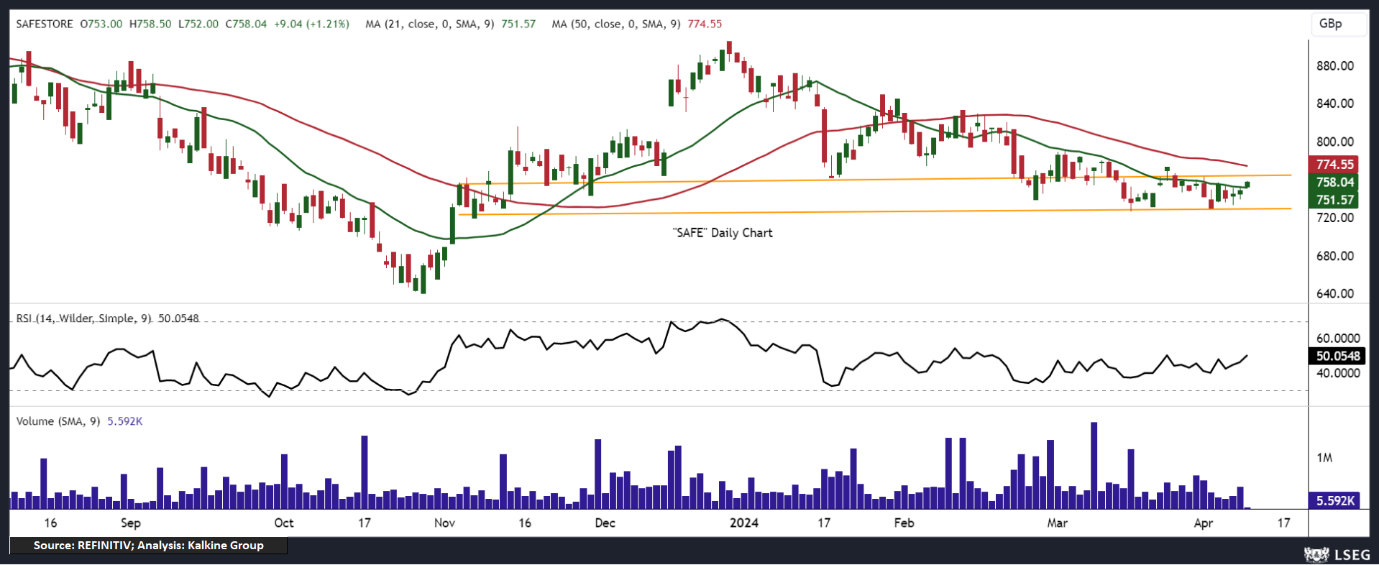
Technical View: In the daily chart, SAFE’s stock has shown strong support near the horizontal channel support line and price consolidation, as depicted in the chart. The stock reacted positively to a new replacement in a top management position as Chief Financial Officer (CFO) in March 2024, which is seen as a positive development for the company's growth. The stock is receiving strong support from the leading indicator 14-period RSI (Relative Strength Index), showing a reading of 50.05, indicating positive territory. Trending indicators such as the 21-day and 50-day SMAs (Simple Moving Averages) are above the CMP (Current Market Price), which may act as small resistance. The stock's trading volume is also increasing, which will likely help in further rallying.
Michelmersh Brick Holdings PLC (LSE: MBH) is an FTSE AIM All-Share index, the company boasts seven market-leading brands: Blockleys, Carlton, Charnwood, Freshfield Lane, Michelmersh, Hathern Terra Cotta, and Floren. Its clay products are manufactured across five production plants.
The company's top-line revenue grew by approximately 13.0% YoY during FY23, and its profit before tax rose by around 9.6% during the same period. MBH's net cash position strengthened from £11.4 million at the end of FY22 to £12.5 million at the end of FY23. MBH will pay a final dividend of 3.00 pence per share on 10 July 2024, with an ex-dividend date of 06 June 2024. Overall, MBH will continue to add to the pipeline of sustainability and manufacturing initiatives and deliver incremental improvements to its processes.
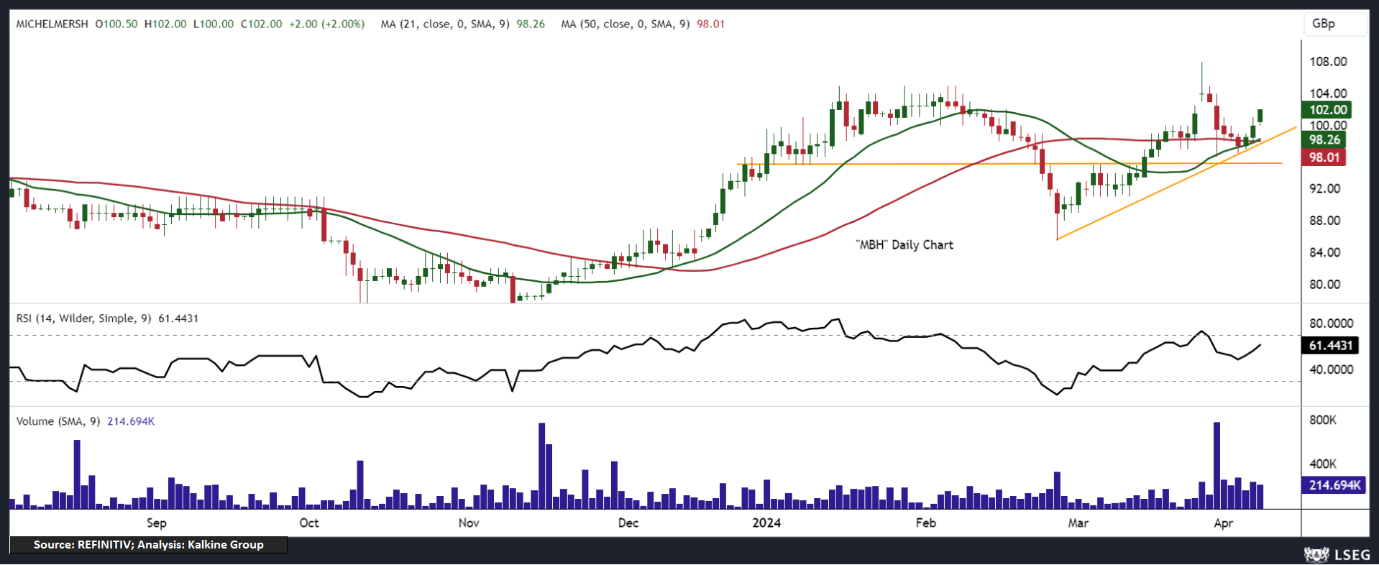
Technical View: On the daily chart, MBH's stock has shown significant strength at bottom levels and is trading higher, supported by a rising trendline. The company released its financials for FY23 in March 2024, reporting a 13% YoY increase in topline growth, surpassing industry estimates, and prompting a positive reaction in the stock price. Stochastic data also indicates recovery from the oversold zone. The stock is receiving major support from the leading indicator, the 14-period RSI (Relative Strength Index), with a reading of 61.44, indicating a bullish trend. Currently, the stock price is trading above both the 21-period and 50-period Simple Moving Averages (SMA), which may serve as dynamic support levels in the future.
Note 1: How to Read the Charts?
The Green colour line reflects the 21-period moving average while the red line indicates the 50-period moving average. SMA helps to identify existing price trends. If the prices are trading above the 21-period and 50-period moving average, then it shows prices are currently trading in a bullish trend.
The Black colour line in the chart’s lower segment reflects the Relative Strength Index (14-Period) which indicates price momentum and signals momentum in trend. A reading of 70 or above suggests overbought status while a reading of 30 or below suggests an oversold status.
The Blue colour bars in the chart’s lower segment show the volume of the stock. The volume is the number of shares that changed hands during a given day. Stocks with high volumes are more liquid than stocks with lesser volume and liquidity in stocks helps in easier and faster execution of the order.
The Orange colour lines are the trend lines drawn by connecting two or more price points and used for trend identification purposes. The trend line also acts as a line of support and resistance.
Technical Indicators Defined: -
Support: A level at which the stock prices tend to find support if they are falling, and a downtrend may take a pause backed by demand or buying interest.
Resistance: A level at which the stock prices tend to find resistance when they are rising, and an uptrend may take a pause due to profit booking or selling interest.


 Please wait processing your request...