
Image Source : Krish Capital Pty Ltd
Index Update: The FTSE 100 index, a key benchmark index for the London stock exchange, went down around 0.04% on 27 August 2025.
Macro Update: U.K. households are expected to see a slight increase in energy costs this winter, following a 2% rise in the energy price cap set by Ofgem, which will take effect from October to December. This adjustment translates to an approximate £2.93 monthly or £35.14 annual increase for an average household on a default tariff. Despite this, the new annual cap of £1,755 remains significantly below its 2023 peak. Ofgem pointed to increased electricity balancing costs as a key contributor to the upward adjustment, though in real terms, the cost remains slightly lower than the same period last year.
Top Market Movers: Among top gainers on FTSE 100 index, JD Sports Fashion PLC (LSE: JD.) witnessed a rise of 3.15% followed by Airtel Africa PLC (LSE: AAF) which gained around 1.29%.
Commodity Update: The dollar remained under pressure on Wednesday as concerns over the Federal Reserve’s independence resurfaced after President Trump’s latest move to exert influence on the central bank. Gold inched up 0.01% to $3,433.60, while silver slipped 0.08% to $38.575 and copper eased 0.02% to $9,845.65. Brent crude edged down 0.06% to $66.66, with oil prices steady as markets awaited new U.S. tariffs on India’s Russian crude imports.
Our Stance: Looking ahead, wage growth in the U.K. is forecast to slow, particularly at the lower end of the income scale. Deutsche Bank anticipates that National Living Wage increases will moderate, projecting private sector wage settlements to ease to around 3% by 2026. This trend coincides with continued compression between the lowest-paid and median earners, especially for part-time roles. While recent years have seen a narrowing of pay differentials, analysts suggest that weaker domestic demand and firms' tighter margins may limit further upward pressure on wages, even as inflation remains a factor.
FTSE 100
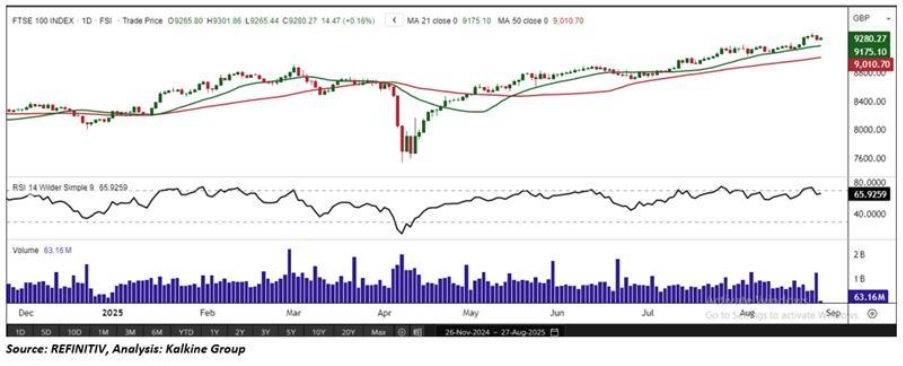
The FTSE 100 edged 0.16% higher on Wednesday, currently trading at 9,280.27, and is shaping a bullish candlestick pattern on the daily chart. The index continues to hold firmly above a key horizontal support level, underscoring strong underlying momentum. Technical indicators remain constructive, with the price comfortably trading above both the 21-period and 50-period Simple Moving Averages (SMAs), which serve as dynamic support levels and highlight sustained buying interest. The Relative Strength Index (RSI) stands at 65.92, reflecting strengthening momentum and suggesting a potential shift toward deeper bullish sentiment. A decisive move above the immediate resistance zone could further confirm the prevailing uptrend, opening the way toward higher targets in the sessions ahead. On the downside, maintaining support at current levels will be crucial to preserving the bullish structure, while any breakdown below the moving averages could trigger a near-term corrective phase.


 Please wait processing your request...