Silver’s “Black Friday” stunned markets. On Friday, January 30, 2026, silver futures (March contracts) suffered a historic 31.4% single-day collapse, settling at $78.53 per ounce. This wasn’t a routine pullback — it was a full-scale liquidity wipeout, the worst daily performance since the Hunt Brothers era of 1980.
After a parabolic surge that briefly pushed prices above $120 earlier in the week, silver — often called the “poor man’s gold” — became the epicenter of a perfect storm: a hawkish Federal Reserve shock, aggressive CME margin hikes, and the violent unwind of a massive gamma squeeze.
The big question now: Is the silver bull run over — or is this the buying opportunity of the decade?
Key Takeaways: The Friday Massacre at a Glance
- The Damage: Silver futures crashed 31.4% to $78.53
- Primary Trigger: Nomination of Kevin Warsh as incoming Fed Chair (viewed as aggressively hawkish)
- Accelerant: CME raised silver margin requirements for the second time in three days
- Risk Signal: Gold/Silver Ratio exploded to ~60:1
- Big Picture: Short-term chaos, long-term structural deficit remains intact
Why Did Silver Crash? Five Forces Behind the Collapse
- The “Warsh Shock”: A Hawkish Fed Pivot
Markets were positioned for policy continuity, but the nomination of Kevin Warsh shattered that assumption. Warsh is widely viewed as a hard-money hawk, prioritizing inflation control and a strong dollar.
Market impact:
- US Dollar Index (DXY) surged
- 10-Year Treasury yields spiked
- Non-yielding assets like silver became instantly less attractive
This single catalyst broke the “easy money” narrative that had fueled speculative demand.
- CME Margin Hikes: The Forced Liquidation Trigger
The CME exists to protect clearinghouse stability — not bull markets.
- Maintenance margins for silver were raised ~36%, effective February 2
- Traders were forced to post millions in fresh collateral over the weekend
- Most couldn’t — triggering panic selling at market
This turned volatility into a self-reinforcing liquidation spiral.
- Gamma Squeeze Unwind: When Hedging Turns Into Selling
Silver’s run to $120 was powered by a classic gamma squeeze, driven by heavy call-option buying.
When prices reversed:
- Market makers dumped their hedges
- Selling pushed prices lower
- Lower prices forced more selling
The result: a mechanical feedback loop that crushed prices in hours.
- China Profit-Taking & Demand Shock
China has been a major silver buyer for solar panels and AI hardware, but prices above $100/oz likely choked off short-term physical demand.
Reports indicate:
- Aggressive profit-taking by Shanghai speculators
- Exit rush ahead of Lunar New Year liquidity slowdown
High prices don’t kill demand forever — but they do pause it.
- The “Sell Everything” Recession Trade
Silver is roughly 50% industrial metal.
As yields surged and recession fears returned:
- Investors dumped cyclical assets
- Silver was sold to raise cash
- Gold outperformed as a pure safe haven
This divergence showed up clearly in ratios.
The Gold/Silver Ratio: The Ultimate Risk Gauge
- Pre-Crash: ~47:1 (extreme silver outperformance)
- Post-Crash: ~60:1 (sharp risk-off shift)
What It Means
- Rising ratios = fear, deleveraging, capital flight to safety
- Historically:
- Below 50 → silver overheated
- 75–80 → silver deeply undervalued
At ~60, the market is neutral — not cheap, not expensive.
Performance Outlook: What Happens Next?
Short Term (1–3 Months): Extreme Volatility
- Trend: Bearish / unstable
- Risk: More forced liquidation, possible further margin hikes
- Key Variable: US dollar strength during confirmation hearings
Medium Term (3–12 Months): Base Building
- Trend: Consolidation / accumulation
- Focus: Industrial restocking demand
- Insight: Solar manufacturers priced out at $120 may return aggressively at $70–75
Long Term (1–3 Years): Bull Structure Intact
- Trend: Bullish
- Reason: Structural silver deficit driven by green energy, electrification, and AI
- Constraint: Mining supply cannot scale fast enough into 2026–2030
Key Technical Levels (Silver Futures)
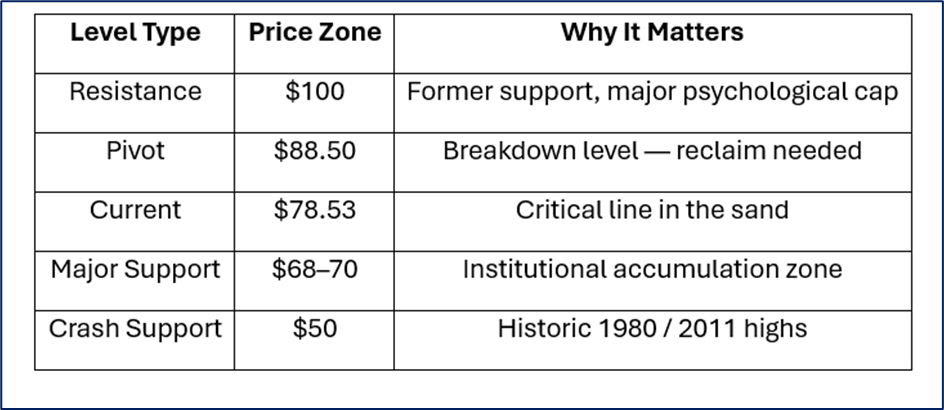
Source: Kalkine Group Analysis
Strategies: How Investors Can Play the Crash
- Survival First: Kill Leverage
- Reduce or eliminate margin exposure
- Volatility remains elevated
- Never average down with leverage
- The Gold/Silver Ratio Switch
- Swap gold → silver if ratio hits 75–80
- Swap silver → gold if ratio compresses toward 50
- Current zone (~60): Wait
- Long-Term Stackers: Dollar-Cost Average
- If silver was attractive at $110, it’s discounted at $78
- Watch physical premiums — large disconnects often signal paper-market stress
- Hedge the Downside
- Consider put options on silver ETFs or futures
- Protect physical holdings against a deeper washout
Final Take: A Violent Reset, Not a Death Sentence
This crash was brutal — but it was also necessary.
Parabolic markets don’t correct politely. The futures market flushed leverage, erased excess speculation, and reset positioning in a single session.
The paper market broke — the physical deficit did not.
Solar panels, EVs, and AI hardware still need silver. Mines still can’t produce it fast enough. And once volatility settles, smart money will quietly accumulate.
Bottom Line:
The weak hands are gone.
The next real buyers are waiting at $68–$70.
Frequently Asked Questions (FAQ)
Why did silver crash 31% in one day?
Silver collapsed due to CME margin hikes, a hawkish Fed shock, forced liquidation of leveraged trades, and the unwind of a large gamma squeeze.
Is the silver bull market over?
No. Short-term damage is severe, but the long-term bull case driven by supply deficits and industrial demand remains intact.
What does the Gold/Silver Ratio signal now?
At ~60:1, the market is neutral. Silver historically becomes attractive again when the ratio reaches 75–80.
Is silver a buy after the crash?
Institutional buyers are likely to step in near $68–70. Long-term investors should favor dollar-cost averaging over leverage.


 Please wait processing your request...