

- Recession risks in 2025 are yellow, not red - but warning lights may be visible.
- AI is transformative, yet pockets of speculation could be forming.
- The four most powerful indicators: credit spreads, yield curves, PMIs, consumer stress.
- Mega-cap tech concentration makes markets appear stronger than they really are.
- The Warren Buffett Indicator adds another valuation red flag.
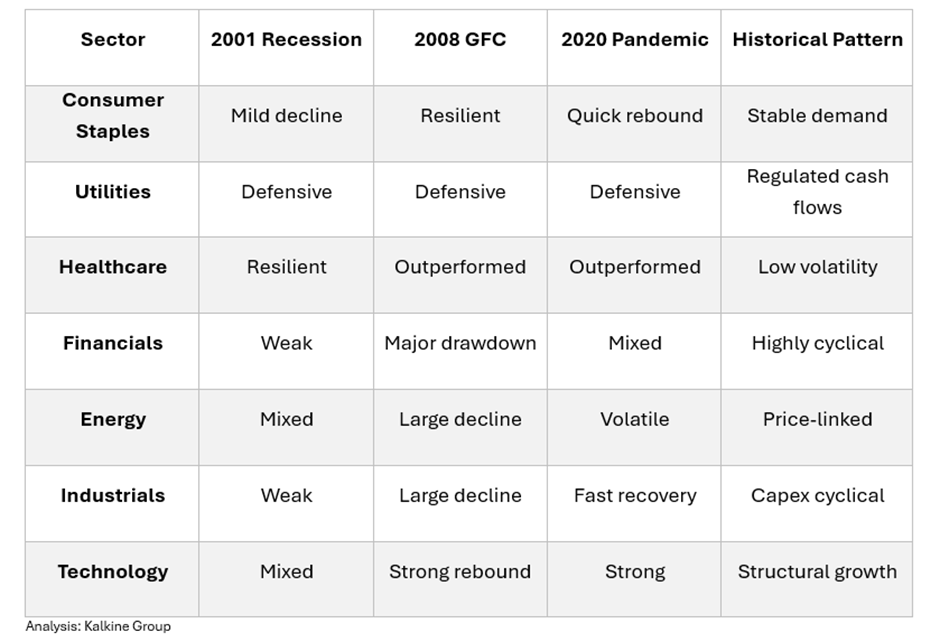
- For UK - certain sectors historically hold up better in slowdowns.
- Consumer Staples often stay resilient as demand for essentials remains steady. Examples: Unilever (LSE: ULVR), Diageo (LSE: DGE), Tesco (LSE: TSCO), J Sainsbury ( LSE: SBRY), Reckitt Benckiser (LSE: RKT)
- Healthcare & Pharma typically see stable demand across economic cycles. Examples: AstraZeneca (LSE: AZN), GlaxoSmithKline (LSE: GSK), Smith & Nephew (LSE: SN), Hikma Pharmaceuticals (LSE: HIK)
- Utilities & Telecoms provide essential, predictable services. Examples: National Grid (LSE: NG), SSE (LSE: SSE), United Utilities (LSE: UU), Pennon Group (LSE: PNN), Vodafone Group (LSE: VOD), BT Group (LSE: BT.A)
- Gold & Precious Metals-Linked Firms can behave differently in risk-off periods. Examples: Fresnillo (LSE: FRES), Centamin (LSE: CEY), Anglo American (LSE: AAL)

The US, UK and major economies are navigating a tricky mix:
- Slowing growth
- Sticky inflation in parts of Europe
- Evolving central-bank policy
- A historic flood of AI-driven investment
The two biggest debates dominating markets:
- Will the global economy dip into recession?
- Is an AI valuation bubble forming?
Below is a clear, retail-friendly breakdown of the signals professionals are watching.

1.1 Credit-Market Signals — The Market’s Early Warning System
Credit markets usually flash stress before equity markets react.
Corporate-Bond Spreads
- Wide spreads = rising perceived risk
- Compressed spreads = possible complacency
High-Yield ("Junk") Spread
Historically:
- Above 500 bps → elevated recession risk
- Sudden spike → early warning of stress in weaker firms
IG vs HY Divergence
If Investment-Grade stays calm while High-Yield blows out → weaker companies tightening first.
1.2 Yield-Curve Signals — The Classic Predictor
Economists closely watch:
- 2-year vs 10-year curve
- 3-month vs 10-year curve
- Near-term forward spread (Fed’s preferred model)
Why It Matters
- Inversions often precede recessions.
- Un-inversions sometimes occur just before the downturn begins.
2025 shows mixed signals: some curves still inverted, others normalising.
1.3 Labour-Market Health — Cracks Form Slowly, Then Suddenly
Key signs economists monitor:
- Falling quits rate (lower worker confidence)
- Decline in temp staffing employment
- Fewer hours worked
- Drop in job openings
Both US JOLTS and UK labour data are key watchpoints.
1.4 Consumer-Stress Indicators — The Heart of GDP
Consumers drive 60–70% of GDP in most developed economies.
Red Flags
- Rising credit-card delinquencies
- Higher auto-loan defaults
- Savings rate below long-term average
- Surge in BNPL (Buy Now Pay Later) usage
Consumer stress → potential economic slowdown.
1.5 PMIs — The Global Activity Pulse
- PMI > 50 = expansion
- PMI < 50 = contraction
Since 2024:
- Manufacturing PMIs remain weak globally
- Services PMIs mixed and slowing in some regions
1.6 Freight, Shipping & Logistics — The Real Economy's X-Ray
Freight indicators are powerful recession predictors:
- Container shipping volumes
- Rail freight tonnage
- Truckload demand
- Global Supply Chain Pressure Index
Declining freight = companies trimming orders = slowdown pressure.
1.7 Corporate Earnings — Reality vs Expectations
Warning signs include:
- Multiple quarters of shrinking profit margins
- Guidance cuts
- Rising inventories vs sales
- Slowing growth in cyclicals (autos, industrials, retail)
1.8 Sentiment Indicators — Soft Data Leads Hard Data
Trends that matter:
- Dropping CEO confidence
- Falling consumer sentiment
- Lower small-business optimism
- Declining investor risk appetite
Sentiment consistently predicts spending patterns.
1.9 The Warren Buffett Indicator — A Big-Picture Valuation Signal
The Buffett Indicator = Total Stock Market Value ÷ GDP
Buffett calls it “the best single measure of broad valuations.”
What It Means:
- Above long-term average → markets possibly overheated
- In line with GDP → fair value
- Below GDP → undervaluation zone
Why It Matters in 2025
Market caps in several major economies have risen faster than GDP, driven by:
- Mega-cap tech
- AI-related speculation
- Rising equity valuations vs slower real-economy growth
Important Context
- Works best for the US (large domestic index).
- Less precise for the UK, because FTSE earnings mostly come from overseas.
- Not a crash predictor — but it highlights valuation stretch.

2.1 Overextended Valuations
AI companies are priced heavily on:
- Future earnings
- Hypothetical efficiency gains
- Long-term adoption curves
When present cashflows don’t support valuations → bubble-like risk.
2.2 Extreme Market Concentration
A handful of mega-cap firms dominate index returns, especially in the US.
High concentration = higher fragility.
2.3 AI Requires Massive Infrastructure Investment
AI depends on:
- Data centres
- Chips
- Electricity
- Cooling systems
- Networking upgrades
These are long-payback projects → more risk if demand expectations shift.
2.4 Profitless AI Startups
Many private AI companies:
- Burn heavy cash
- Depend on funding cycles
- Have unproven revenue models
A funding squeeze could ripple into public markets.
2.5 AI-Driven Trading & Herding Risk
Research suggests:
- AI traders reduce emotional bias
- But tend to herd quickly
- Potentially amplifying volatility in selloffs
Regulators are increasingly monitoring AI’s market impact.

Ray Dalio
- AI valuations show “bubble-like behaviour”
- Debt cycles + geopolitical stress = fragility
- Corrections often need a trigger (policy shock, liquidity tightening)
GMO-Style Value Investors
- Highlight parallels between mega-cap tech valuations and past speculative cycles
- Flag concentration risk
Moderate Voices
- Not forecasting collapse
- Expecting volatility, not disaster
- Focused on long-term potential of AI

4.1 UK Sectors That Tend to Show Resilience
Consumer Staples
Essential goods (food, household products) show less demand fluctuation.
Examples: Unilever (LSE: ULVR), Diageo (LSE: DGE), Tesco (LSE: TSCO), J Sainsbury ( LSE: SBRY), Reckitt Benckiser (LSE: RKT)
Healthcare & Pharma
Demand remains stable even during economic slowdowns.
Examples: AstraZeneca (LSE: AZN), GlaxoSmithKline (LSE: GSK), Smith & Nephew (LSE: SN), Hikma Pharmaceuticals (LSE: HIK)
Utilities & Telecoms
Essential services with predictable cashflows.
Examples: National Grid (LSE: NG), SSE (LSE: SSE), United Utilities (LSE: UU), Pennon Group (LSE: PNN), Vodafone Group (LSE: VOD), BT Group – BT.A.
Gold & Precious Metals–Linked Firms
Sometimes benefit from risk-off environments.
Examples: Fresnillo (LSE: FRES), Centamin (LSE: CEY), Anglo American (LSE: AAL)
4.2 UK Sectors More Exposed During Slowdowns
Historically weaker when growth slows:
- Retail discretionary
- Autos
- Construction
- Housebuilders
- Cyclical industrials
- Financials (dependent on loan growth and borrower strength)

5.1 Signals ≠ Certainty
Indicators highlight probabilities — not outcomes.
Possible scenarios range from:
- Mild slowdown
- AI-valuation reset
- Policy-driven correction
- Soft landing
All remain on the table.
5.2 Think in Broad Scenarios, Not Predictions
Markets rarely move in straight lines — scenario thinking reduces emotional bias.
5.3 Diversification Reduces Stress
Spreading across:
- Sectors
- Countries
- Styles (growth, value, cyclical, defensive)
can reduce volatility and concentration risk.
5.4 Follow Data, Not Headlines
Key indicators worth monitoring:
- Yield-curve steepening/inversions
- Corporate guidance
- PMIs
- Delinquency trends
- Credit spreads
They offer signal — not noise.
5.5 Keep the Long Game in Focus
- AI’s long-term potential is enormous.
- Short-term hype ≠ long-term outcomes.
- Separating innovation from speculation is the crucial skill of the decade.
Final Thoughts
2025’s risk landscape is cautionary, not catastrophic:
- Partly inverted yield curves
- Compressed credit spreads
- Rising consumer delinquencies
- Slowing freight demand
- Elevated equity valuations
- Softening corporate guidance
- PMIs hovering around contraction
- High Buffett Indicator readings in some major markets
AI bubble concerns arise from:
- Extreme concentration
- Valuation stretch
- Capital-heavy infrastructure demands
- Unproven business models
Professionals aren’t calling for collapse — but they are calling for deeper vigilance. The smart move for retail readers is not prediction — it’s understanding how and why these signals matter.


 Please wait processing your request...