
Highlights
- Admiral Group delivered a 69.4% year-over-year increase in profit before tax to GBP 521 million in H1FY25
- The company expects claims trends to remain stable and margins to stay resilient in H2 FY25, supported by disciplined pricing and effective cost management
Admiral Group PLC (LSE:ADM) is an FTSE 100 company offering insurance services across the UK, Spain, Italy, and France, along with operating a price comparison business in the United States.
In the first half of financial year 2025 (H1FY25), the company delivered improved results, with profit before tax increasing 69.4% year-over-year to GBP 521 million and insurance revenue rising 18.2% to GBP 2.47 billion. Earnings per share grew 72.3% to GBX 132.5, driven by continued gains in UK insurance underwriting, particularly in the motor segment, and higher investment returns. The company’s performance highlights effective capital management and an improvement in operating profit, which rose 66% to GBP 533 million.
Recent Business Update
In May 2025, the company announced the appointment of Paola Bonomo as an Independent Non-Executive Director, which was effective from 12 May 2025.
Company Outlook
The company expects profitability from the prior underwriting years to continue benefiting results in the second half of the year. Claims frequency remains stable, while average claims cost inflation is estimated at around 5–7%. Margins are anticipated to stay resilient, supported by a lower expense ratio and an improved insurance service margin of 18.8% exiting the first half.
Although market pricing has become more competitive, the company’s disciplined approach toward new business versus renewals and its moderate customer growth of around 5% year-over-year (as of June) are expected to help maintain a low-70s combined ratio, in line with the first-half level of 71.2%, alongside stable claims frequency trends.
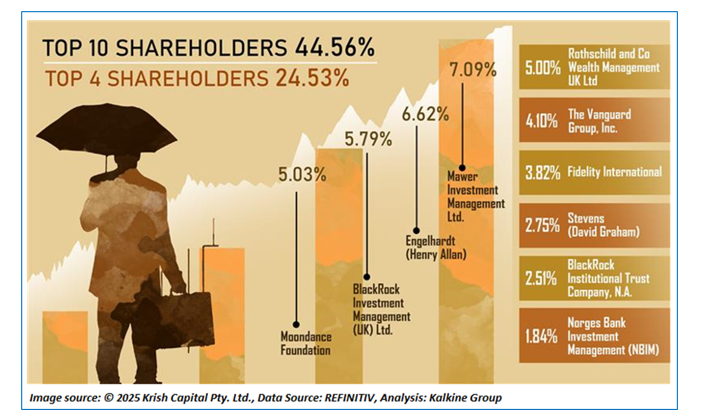
Top Shareholders
The top 10 shareholders collectively account for approximately 44.56% of the company’s total shareholding. Mawer Investment Management Ltd. and Henry Allan Engelhardt are the largest shareholders, holding around 7.09% and 6.62% stakes, respectively.
Stock Information
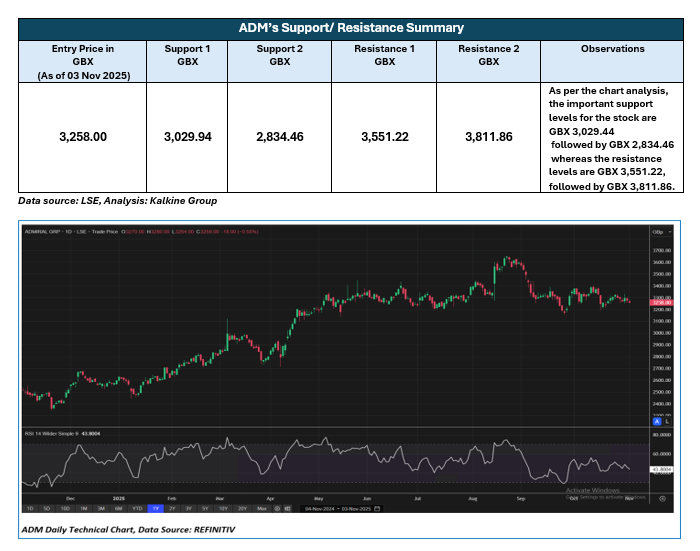
The stock has gained approximately 2.29% over the past six months and about 22.21% over the past nine months. It is currently trading above its 52-week range, which spans from a low of GBX 2,342.35 to a high of GBX 3,655.56.
Note 1: Past performance is not a reliable indicator of future performance.
Note 2: The reference data for all price data, currency, technical indicators, support, and resistance levels is 03 November 2025. The reference data in this report has been partly sourced from EODHD/Others.
Technical Indicators Defined
Support: A level at which the stock prices tend to find support if they are falling, and a downtrend may take a pause backed by demand or buying interest. Support 1 refers to the nearby support level for the stock and if the price breaches the level, then Support 2 may act as the crucial support level for the stock.
Resistance: A level at which the stock prices tend to find resistance when they are rising, and an uptrend may take a pause due to profit booking or selling interest. Resistance 1 refers to the nearby resistance level for the stock and if the price surpasses the level, then Resistance 2 may act as the crucial resistance level for the stock.


 Please wait processing your request...