
Highlights
- Admiral Group delivered flat H1FY25 turnover, operating profit rose 66.0% YoY, outpacing revenue growth
- Profit for the period increased 68.9%, supported by higher margins across core insurance operations
- Outlook highlights focus on underwriting discipline, technology investment, and reduced reliance on UK motor following the US exit
Admiral Group PLC (LSE:ADM) is a constituent of the FTSE 100 and operates insurance businesses across the UK, Spain, Italy, and France, alongside a price comparison platform in the United States.
Admiral’s result for the first half of fiscal year 2025 (H1FY25) ended 30 June 2025 shows group turnover of GBP 3.10 billion, unchanged from H1FY24. Operating profit for the period stands at GBP 533.00 million compared with GBP 321.40 million in H1FY24, reflecting a year‑on‑year increase of 66.0%.
Profit for the period is GBP 400.80 million against GBP 237.20 million in H1FY24, up 68.9%. Revenue, gross profit, and net profit all increased, with profitability rising faster than top‑line growth.
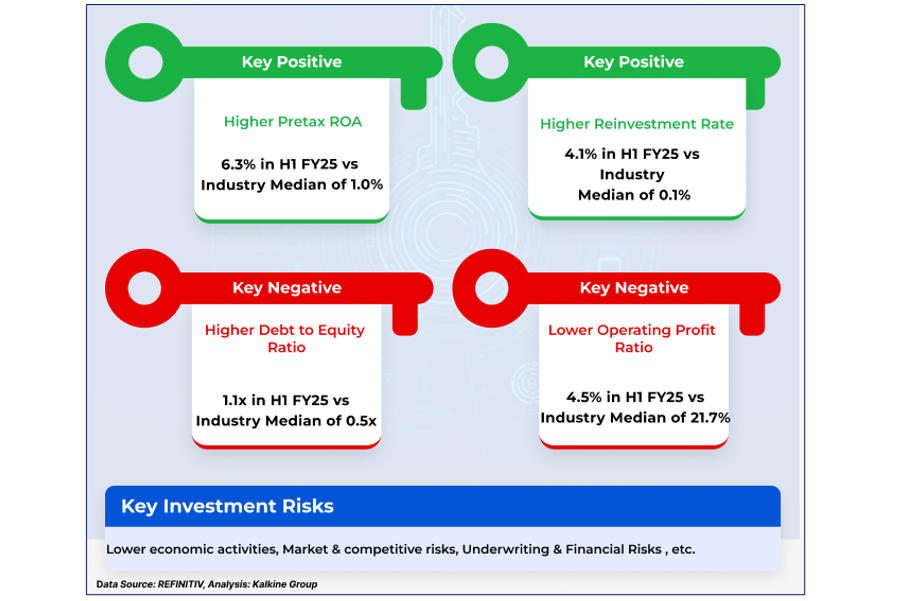
Moreover, in H1FY25, the company’s debt-to-equity ratio eased to 1.10x, alongside an increase in the reinvestment rate to 4.10%.
Company Outlook
The company reports that, despite a softer market, its pricing and combined ratio of 77.7% support underwriting profitability, backed by its insurance service margin and ancillary income. Profits in Household and Admiral Money more than doubled, with the US exit focusing attention on these segments and reducing reliance on UK motor. The company states that its solvency ratio and return on equity support shareholder returns, and that ongoing technology investment and operational changes are intended to meet regulatory and market developments while maintaining its dividend policy.
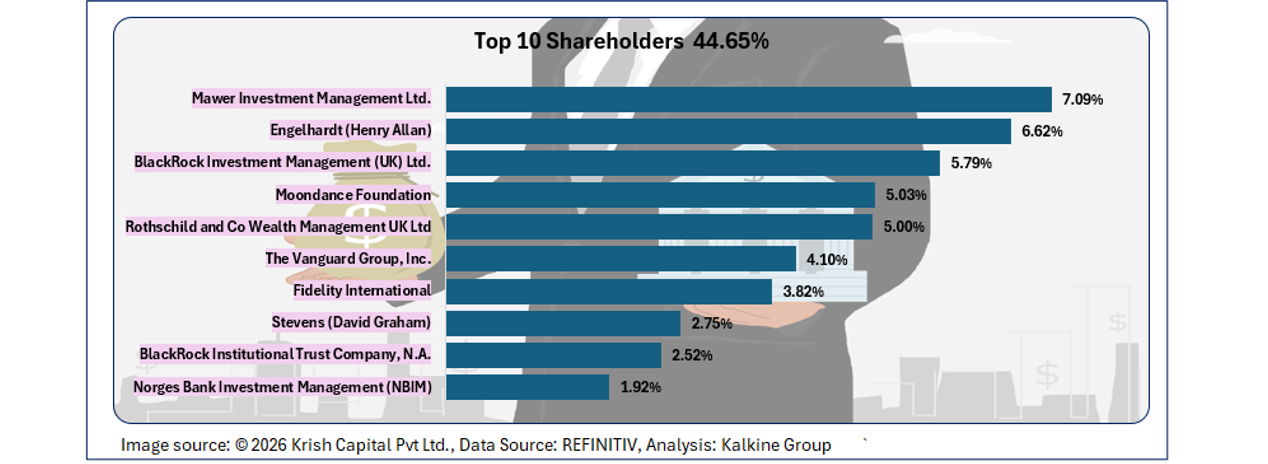
Top 10 Shareholders
The top 10 shareholders collectively account for about 44.65% of total shareholding. Mawer Investment Management Ltd. and Engelhardt (Henry Allan) are the largest shareholders, with stakes of approximately 7.09% and 6.62%, respectively.
Stock Information
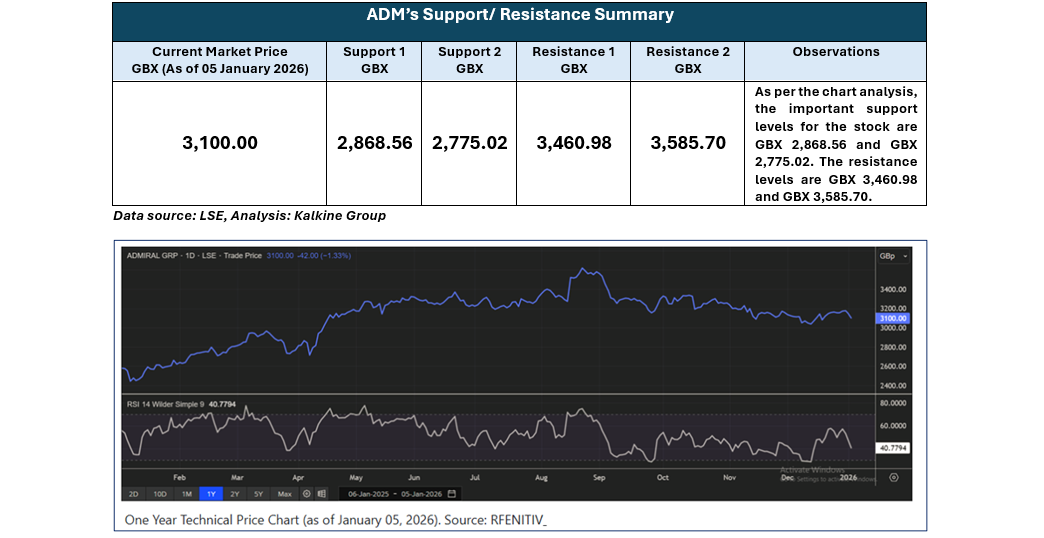
The stock declined by around 0.19% over the past week, while registering a gain of approximately 3.67% over the past three months. It recorded a 52-week high of GBX 3,665.56 and a 52-week low of GBX 2,443.60 and is currently trading above the midpoint of its 52-week price range.
Note 1: Past performance is not a reliable indicator of future performance.
Note 2: The reference data for all price data, currency, technical indicators, support, and resistance levels is 05 January 2026. The reference data in this report has been partly sourced from EODHD/Others.
Technical Indicators Defined
Support: A level at which the stock prices tend to find support if they are falling, and a downtrend may take a pause backed by demand or buying interest. Support 1 refers to the nearby support level for the stock and if the price breaches the level, then Support 2 may act as the crucial support level for the stock.
Resistance: A level at which the stock prices tend to find resistance when they are rising, and an uptrend may take a pause due to profit booking or selling interest. Resistance 1 refers to the nearby resistance level for the stock and if the price surpasses the level, then Resistance 2 may act as the crucial resistance level for the stock.


 Please wait processing your request...