
Highlights
- ENQ's FY24 revenue fell by 20.6% YoY, while adjusted EBITDA declined by 18.4%.
- EnQuest acquired 53.125% stake in Vietnam’s Chim Sáo and Dua fields for ~USD 25.7 million.
- EnQuest has maintained FY25 production guidance of 40,000–45,000 Boepd with USD 190 million capex.
EnQuest PLC (LSE: ENQ) is an FTSE All-Share-listed energy transition company focused on oil and gas production while exploring new energy and decarbonisation opportunities.
In the financial year (FY24), the company’s revenue fell by 20.6% YoY to USD 1,180.7 million due to lower production volumes, which declined 7.0% to 40,736 Boepd, and softer commodity prices, with the realised oil price down to USD 80.2/bbl. Adjusted EBITDA declined by 18.4% YoY to USD 672.6 million, down from USD 824.7 million in FY23. Net debt decreased by 19.8% YoY to USD 385.8 million due to steady free cash flow, repayment of a vendor loan, and full settlement of the RBL facility.
Business Update
ENQ acquired Harbour Energy’s Vietnam business for ~USD 25.7 million, gaining a 53.125% stake and operatorship in the Chim Sáo and Dua fields (Block 12W), which held 7.5 million boe in 2P reserves and 4.9 million boe in 2C resources as of January 2025. The company received two PETRONAS Emerald Awards, including Operator of the Year for a second consecutive year, a first in the award's history, and the Abandonment Excellence award.
Company Outlook
EnQuest reaffirms its FY25 production guidance of 40,000–45,000 Boepd, with planned capital expenditure of USD 190 million, operating expenses of USD 450 million, and decommissioning costs of USD 60 million. The company continues to focus on operating cost reductions to maintain production, improve capital efficiency, and lower emissions amid a softer commodity price environment.
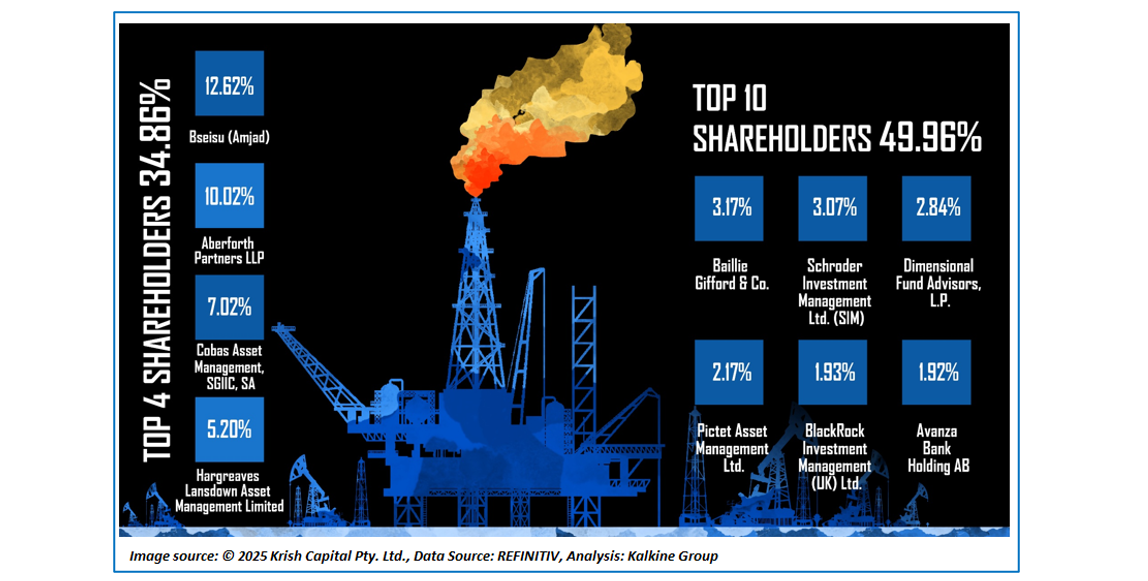
Top 10 Shareholder
The top 10 shareholders collectively own approximately 49.96% of the company’s total shares, with the largest stakes held by Bseisu (Amjad) at around 12.62% and Aberforth Partners LLP at about 10.02%.
Stock Information
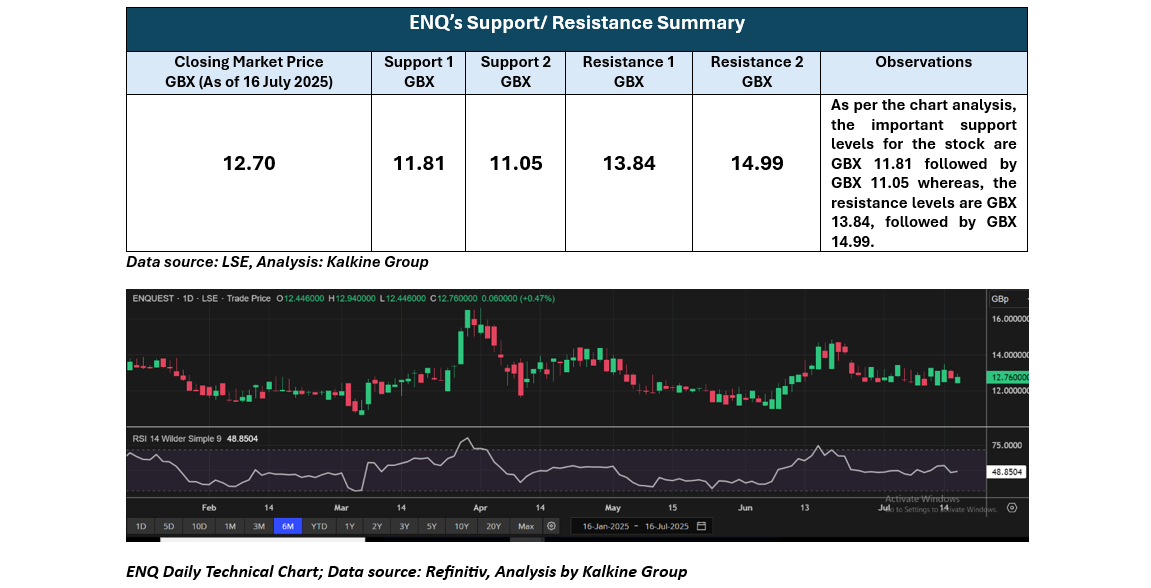
The stock has declined by approximately 3.47% over the past month and 2.29% over the past six months. As of 16 July 2025, the stock closed at GBX 12.76, trading above the average of the 52-week low of GBX 9.952 and the 52-week high of GBX 16.6.
Note 1: Past performance is not a reliable indicator of future performance.
Note 2: The reference data for all price data, currency, technical indicators, support, and resistance levels is 16 July 2025. The reference data in this report has been partly sourced from EODHD/Others.
Technical Indicators Defined
Support: A level at which the stock prices tend to find support if they are falling, and a downtrend may take a pause backed by demand or buying interest. Support 1 refers to the nearby support level for the stock and if the price breaches the level, then Support 2 may act as the crucial support level for the stock.
Resistance: A level at which the stock prices tend to find resistance when they are rising, and an uptrend may take a pause due to profit booking or selling interest. Resistance 1 refers to the nearby resistance level for the stock and if the price surpasses the level, then Resistance 2 may act as the crucial resistance level for the stock.


 Please wait processing your request...