Image source: Shutterstock
Highlights
- ALTN’s FY24 revenue rose by 49.8% yoy, driven by a 14% increase in gold production.
- The company reported a profit after tax of USD 26.42 million for the period.
- AltynGold reported the completion of plant expansion at Sekisovskoye, aiming for an annual gold output of 50,000 ounces
AltynGold PLC (LSE: ALTN) is a UK-based gold producer focused on mining and development projects in Kazakhstan.
In the financial year 2024 (FY24), the company’s revenue increased by 49.8% yoy to USD 96.52 million, primarily driven by a 14% increase in gold production and a 24% rise in the average gold price achieved. Adjusted EBITDA surged by 116.5% yoy to USD 19.70 million, driven by enhanced production capacity following the commissioning of a third production line at Sekisovskoye and favourable gold market conditions during FY24. However, Profit after tax rose by 133.2% yoy to USD 26.42 million, primarily driven by higher revenues and effective cost management.
Recent Business Update
In Q1 FY25, ALTN recorded a 34% YoY increase in mined ore to 208kt and a 57% YoY rise in milled ore to 205kt, reflecting the impact of the third processing line coming online. Revenue grew 61% YoY to USD 25.3 million, driven by higher sales volumes and a 36% YoY increase in gold prices to USD 2,831/oz.
Company Outlook
AltynGold reported the completion of plant expansion at Sekisovskoye, which is now fully operational and targeting a consistent processing rate of 83 kt per month, intending to exceed 50,000 ounces of annual gold output. In the first quarter, 280 kt of ore was processed, with the upgraded line stabilizing by March and reaching a monthly output of 75 kt, supporting confidence in meeting the full-year target.
The company is planning to expand its portfolio through regional and domestic opportunities, with the aim of becoming a leading gold producer by leveraging Kazakhstan’s favourable mining environment.
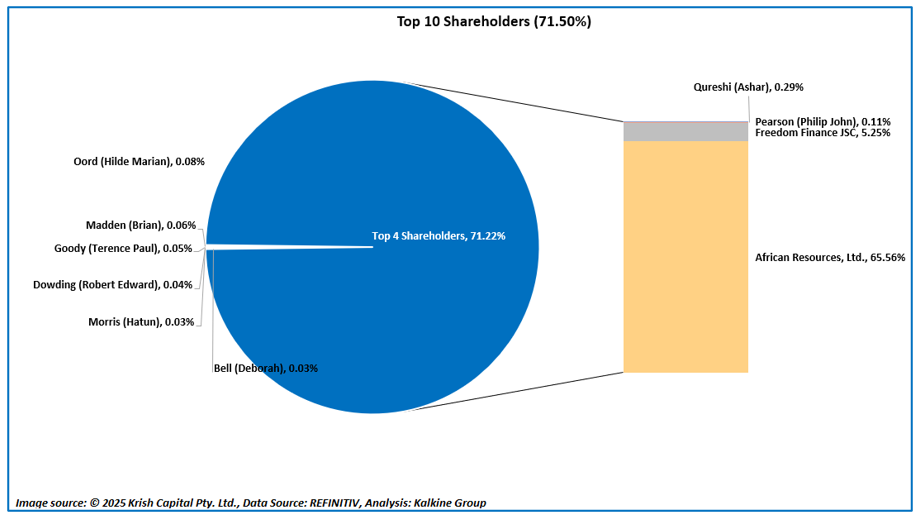
Top 10 Shareholders of ALTN
The top 10 shareholders of ALTN collectively hold approximately ~71.50% of the total shareholding. African Resources Ltd. holds the largest stake at around ~65.56%, followed by Freedom Finance JSC with approximately ~5.25%.
Stock Information
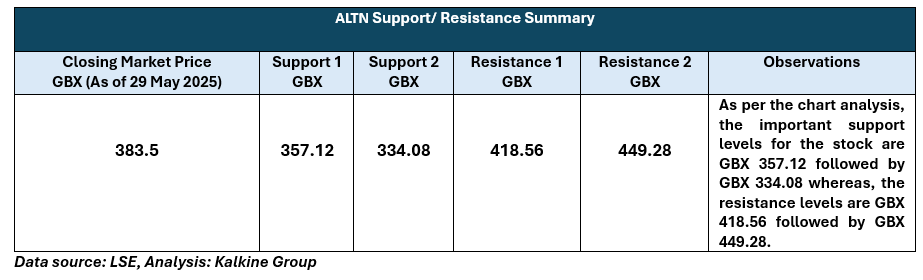
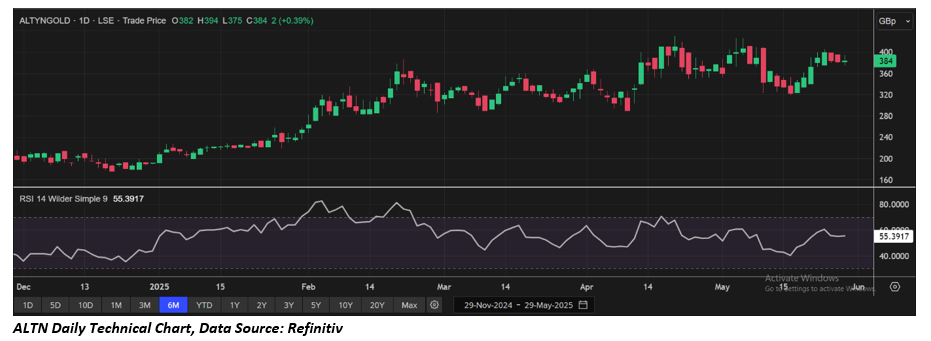
The stock surged ~16.56% over the past three months. It has a 52-week range between GBX 102.00 and GBX 430.00. Currently, it trades above the average of this range, closing at GBX 383.5 on 29 May 2025.
Note 1: Past performance is not a reliable indicator of future performance.
Note 2: The reference data for all price data, currency, technical indicators, support, and resistance levels is 29 May 2025. The reference data in this report has been partly sourced from EODHD/Others.
Technical Indicators Defined
Support: A level at which the stock prices tend to find support if they are falling, and a downtrend may take a pause backed by demand or buying interest. Support 1 refers to the nearby support level for the stock and if the price breaches the level, then Support 2 may act as the crucial support level for the stock.
Resistance: A level at which the stock prices tend to find resistance when they are rising, and an uptrend may take a pause due to profit booking or selling interest. Resistance 1 refers to the nearby resistance level for the stock and if the price surpasses the level, then Resistance 2 may act as the crucial resistance level for the stock.


 Please wait processing your request...