
Highlights
- Revenue for H1 FY25 increased 3.0% year-on-year to USD 35.14mn, supported by higher-margin Showcase advertising and new content additions.
- Operating profit turned positive at USD 1.31mn in H1 FY25, compared with an operating loss of USD 1.26mn in H1 FY24.
- Net margin improved to 3.60% in H1 FY25, compared with negative 4.00% in H1 FY24.
- H2 FY25 outlook references the Adelicious acquisition, which added 20mn monthly downloads and expanded UK and European reach.
Audioboom Group PLC (LSE:BOOM) is a Jersey-headquartered podcast publishing company. It operates an advertising and monetisation platform that underpins its content operations, providing commercial, distribution, marketing, and production services to a portfolio of leading podcast creators.
Financial Performance
During H1 FY25, the company recorded measurable improvements across margins and profitability, supported by changes in revenue mix and operating efficiency when compared with the corresponding prior periods.
Revenue performance showed moderate growth over the period. Revenue for H1 FY25 stood at USD 35.14mn, up from USD 34.12mn in H1 FY24, reflecting a year-on-year increase of 3.0%. The increase was attributed to growth within the higher-margin Showcase advertising platform and contributions from newly added content.
Profitability metrics improved significantly on a year-on-year basis. Operating profit turned positive at USD 1.31mn in H1 FY25, compared with an operating loss of USD (1.26)mn in H1 FY24. This shift reflected the combined impact of higher gross margins and tighter control over overhead expenses during the period.
At the bottom line, profit after taxation reached USD 1.25mn in H1 FY25, compared with a loss of USD (1.34)mn in H1 FY24, marking a clear year-on-year improvement. The movement was driven by higher-margin revenue growth alongside effective cost management, demonstrating improved operating leverage.
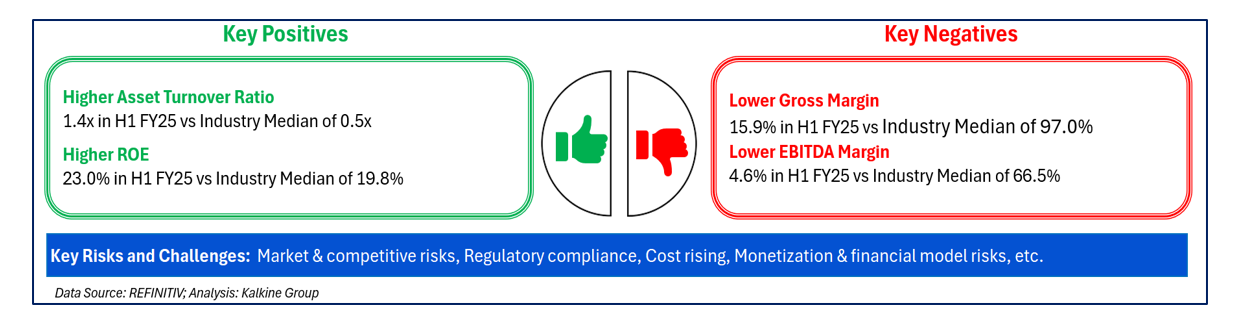
Margin performance also strengthened during the period. Gross margin increased to 15.90% in H1 FY25, up from 9.20% in H1 FY24 and 12.40% in H1 FY23, reflecting a shift toward higher-margin products. Similarly, net margin improved to 3.60% in H1 FY25, compared with negative 4.00% in H1 FY24 and negative 33.40% in H1 FY23, indicating improved efficiency and revenue quality over time.
Overall, the H1 FY25 results highlight year-on-year improvements across revenue, margins, and profitability metrics, with comparisons clearly showing a turnaround from losses reported in earlier periods.
Company Outlook
For H2 FY25, management guidance highlights the impact of the Adelicious acquisition, which has expanded the company’s UK and European presence and added 20 million monthly downloads.
The outlook also reflects the contribution from peak seasonal demand, ongoing growth in the higher-margin Showcase platform, and the addition of new premium content.
According to management guidance, these factors are referenced alongside the company’s enhanced scale and technology, forming the basis of its stated outlook for the remainder of the financial year.
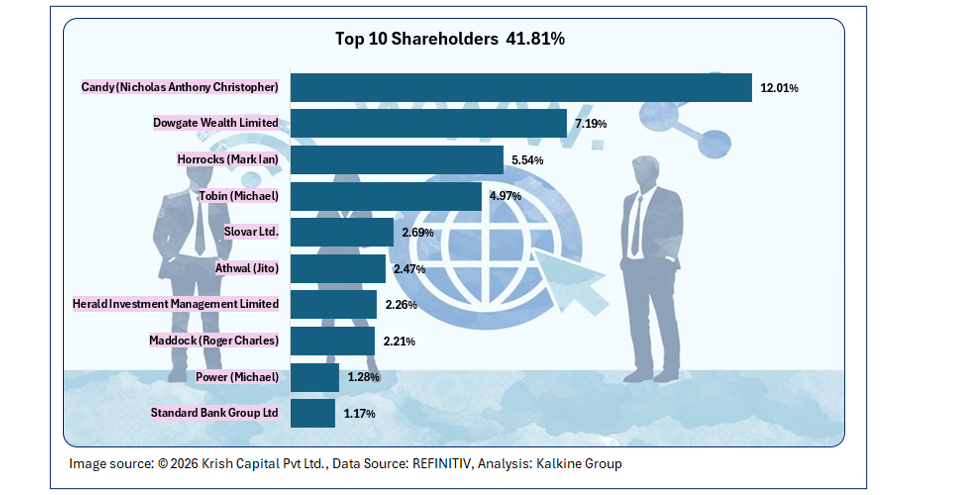
Top 10 Shareholders
The top 10 shareholders collectively own about ~41.81% of the company's total shares. Candy (Nicholas Anthony Christopher) and Dowgate Wealth Limited hold a maximum stake in the company at ~12.01% and ~7.19%, respectively.
Stock Information
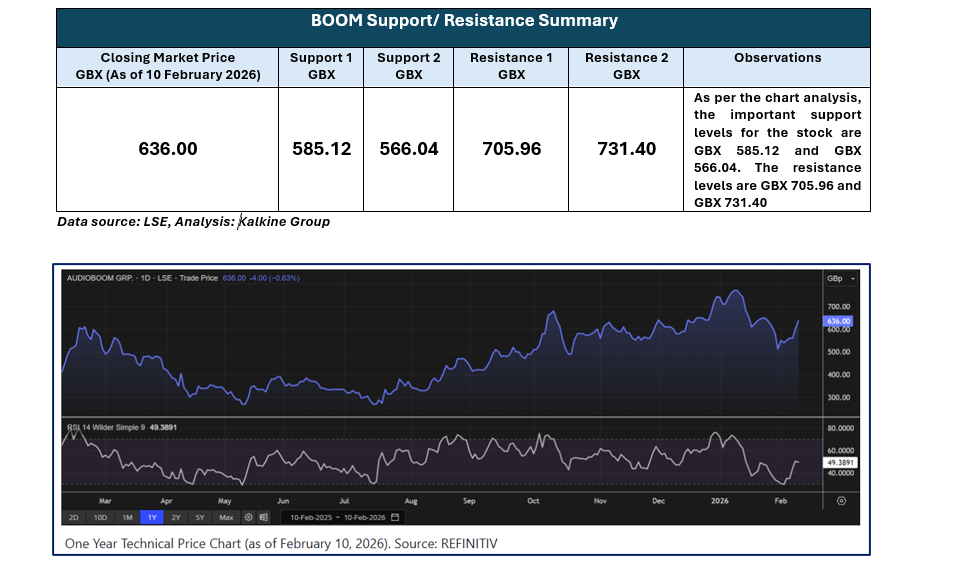
BOOM has declined by ~19.99% over the last 1 week while gaining approximately ~6.00% over the last three months. The stock has a 52-week high and 52-week low of GBX 810.00 and GBX270.00, respectively, and is currently trading above the average of 52-week high-low level.
Note 1: Past performance is not a reliable indicator of future performance.
Note 2: The reference data for all price data, currency, technical indicators, support, and resistance levels is 10 February 2026. The reference data in this report has been partly sourced from EODHD/Others.
Technical Indicators Defined
Support: A level at which the stock prices tend to find support if they are falling, and a downtrend may take a pause backed by demand or buying interest. Support 1 refers to the nearby support level for the stock and if the price breaches the level, then Support 2 may act as the crucial support level for the stock.
Resistance: A level at which the stock prices tend to find resistance when they are rising, and an uptrend may take a pause due to profit booking or selling interest. Resistance 1 refers to the nearby resistance level for the stock and if the price surpasses the level, then Resistance 2 may act as the crucial resistance level for the stock.


 Please wait processing your request...