
Highlights
- Big Yellow Group’s gross margin expanded to 70.40% in H1 FY26, reflecting improved cost control and rental income growth.
- The company’s H1 FY26 revenue rose 2.0% to GBP 105.10 million, supported by higher net rental pricing.
- The company’s profit and total comprehensive income declined 49.1% year-on-year, mainly due to lower property revaluation gains.
- Management expects gradual occupancy improvement in H2 FY26, with EPS growth projected at around 2%
Big Yellow Group PLC (LSE:BYG) is an FTSE 250-listed company that operates in the self-storage sector. It provides secure, modern storage units designed for both household and business use.
Financial Performance
During the first half of financial year 2026 (H1FY26), the company reported a modest improvement in top-line performance, with revenue rising to GBP 105.10 million from GBP 103.00 million in H1 FY25, reflecting a year-on-year increase of 2.0%. This growth was primarily driven by a 4% rise in the average achieved net rent per square foot, indicating improved pricing across the portfolio.
Gross profit increased to GBP 74.00 million in H1 FY26, compared with GBP 70.80 million in the corresponding prior-year period, representing a 4.5% year-on-year improvement. The uplift in gross profit was supported by higher rental income alongside effective management of store-level operating costs. As a result, the gross margin expanded to 70.40% in H1 FY26, compared with 68.80% in H1 FY25, highlighting improved operating leverage.
Profit and total comprehensive income declined significantly during the period, falling to GBP 74.20 million in H1 FY26 from GBP 145.70 million in H1 FY25, a decrease of 49.1% year-on-year. The reduction was largely attributable to a sharp fall in property revaluation gains compared with the prior period, rather than underlying trading performance.
From an efficiency perspective, operational metrics showed improvement. Cash cycle days reduced to negative 49.10 days in H1 FY26, compared with negative 19.30 days in H1 FY25, indicating faster cash conversion and improved working capital efficiency over the period.
Recent Updates
The company released its trading statement on 20 January 2026, in which the company posted steady Q3 revenue growth of 2%, supported by favourable seasonal occupancy patterns. Rent per square foot rose by 4%, highlighting solid pricing momentum. Progress continues the Group’s development pipeline, and its prudent capital structure leaves the business well-positioned to benefit from any easing in interest rates.
Company Outlook
For the H2 FY26, management expects gradual improvements in occupancy levels and projects earnings per share (EPS) growth of around 2%. The ongoing development pipeline is set to contribute meaningful NOI expansion, while potential interest rate reductions could further boost profitability. Overall, the team remains confident in the company’s favourable freehold-focused model and advantageous property locations.
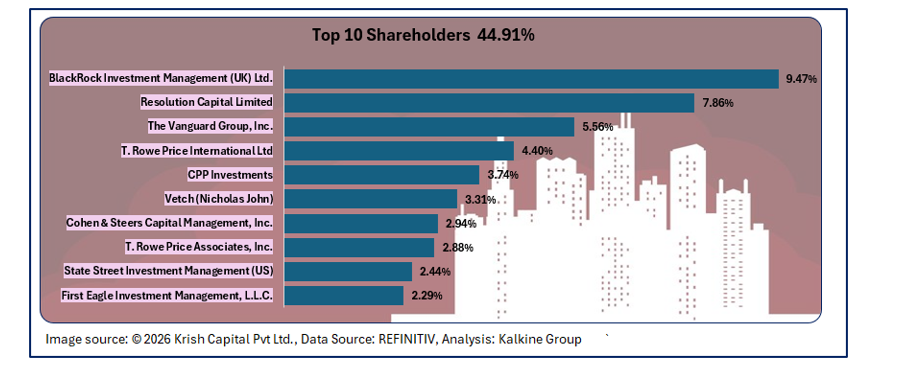
Top 10 Shareholder
The top 10 shareholders collectively own about ~44.91% of the company's total shares. BlackRock Investment Management (UK) Ltd. and Resolution Capital Limited hold a maximum stake in the company at ~9.47% and ~7.86%, respectively.
Stock Information
BYG is down by ~0.76% in the past week while declining approximately 7.01%% over the last three months. The stock has a 52-week high and 52-week low of GBX 1208.00 and GBX 829.00, respectively, and is currently trading above the average of 52-week high-low level.
Note 1: Past performance is not a reliable indicator of future performance.
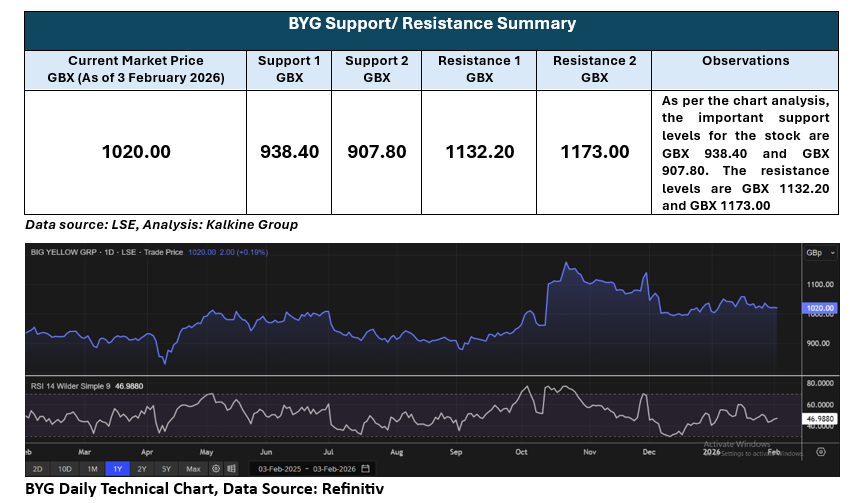
Note 2: The reference data for all price data, currency, technical indicators, support, and resistance levels is 3 February 2026. The reference data in this report has been partly sourced from EODHD/Others.
Technical Indicators Defined
Support: A level at which the stock prices tend to find support if they are falling, and a downtrend may take a pause backed by demand or buying interest. Support 1 refers to the nearby support level for the stock and if the price breaches the level, then Support 2 may act as the crucial support level for the stock.
Resistance: A level at which the stock prices tend to find resistance when they are rising, and an uptrend may take a pause due to profit booking or selling interest. Resistance 1 refers to the nearby resistance level for the stock and if the price surpasses the level, then Resistance 2 may act as the crucial resistance level for the stock.


 Please wait processing your request...