
Image source: Bself, Shutterstock
Highlights
BP PLC (LSE: BP), headquartered in London, is a prominent multinational oil and gas company listed on the FTSE 100. With operations spanning across Australasia, Europe, Africa, Asia, North and South America, BP is a key player in the global energy industry.
Key highlights from FY23
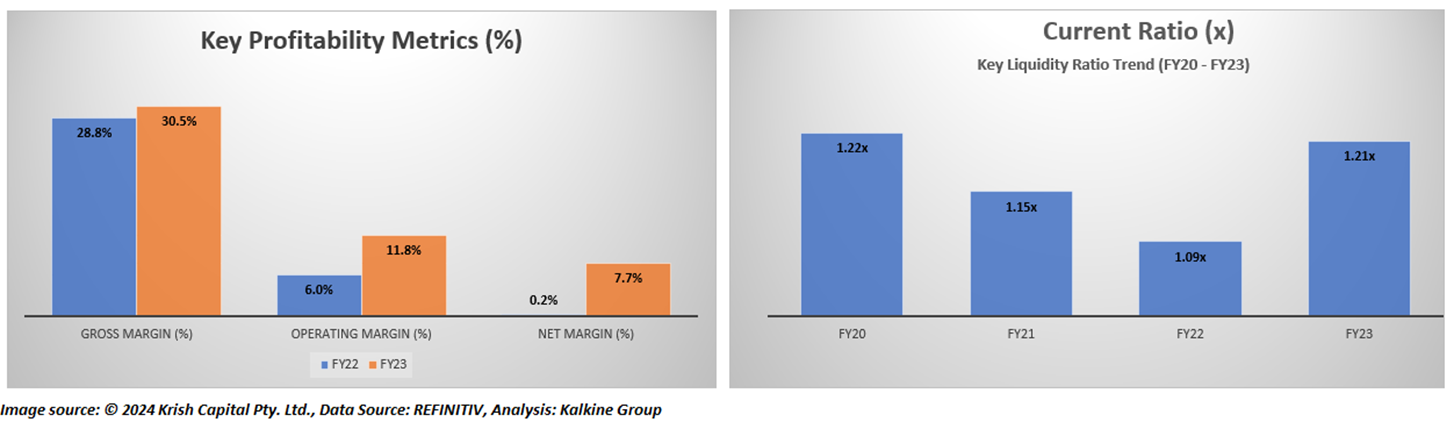
In FY2023, the company witnessed a notable increase in both gross and net margins, reaching 30.5% and 7.7% respectively, compared to 28.8% and 0.2%, respectively, in fiscal year 2022. Other business highlights include:
- The production in Q4 FY23 rose by 8.6% compared to Q4 FY22, while the overall FY23 production increased by 6.7% over FY22, attributed to enhanced performance in BPX Energy and key product segments.
- The company reported a profit attributable to BP shareholders of USD 15,239 million in FY23, a significant turnaround from the USD 2,487 million loss in FY22.
- The company's annualized dividend yield for FY23 stood at approximately 4.35% based on the closing stock price on April 9, 2024. Moreover, the company announced share buybacks of USD 1.75 billion for Q4 FY23 and USD 3.5 billion for H1 FY24.
- The company is anticipating increased upstream production in Q1 FY24 compared to Q4 FY23, driven by higher oil production and improved gas and low carbon energy operations.
Key metrics
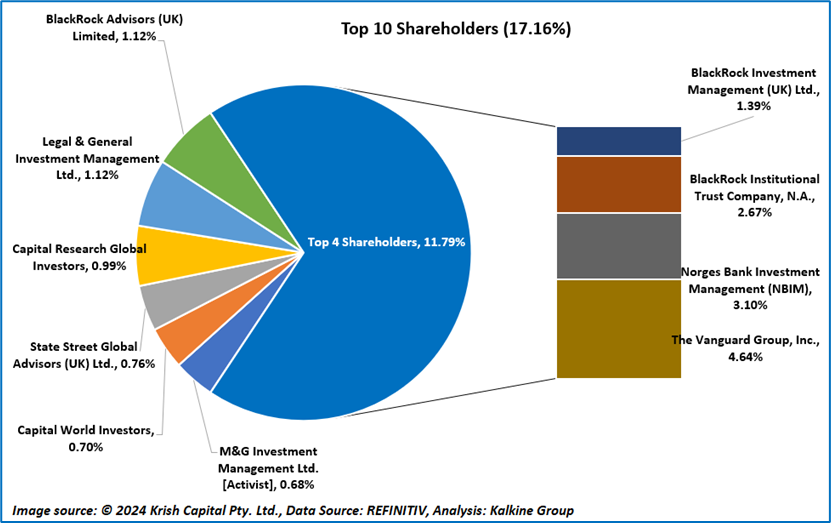
Top 10 shareholders
The combined ownership of the top 10 shareholders in the company stands at approximately 17.16%. The Vanguard Group, Inc. holds the largest stake at around 4.64%, followed by Norges Bank Investment Management (NBIM) with approximately 3.10%, as illustrated in the chart below.
Stock performance
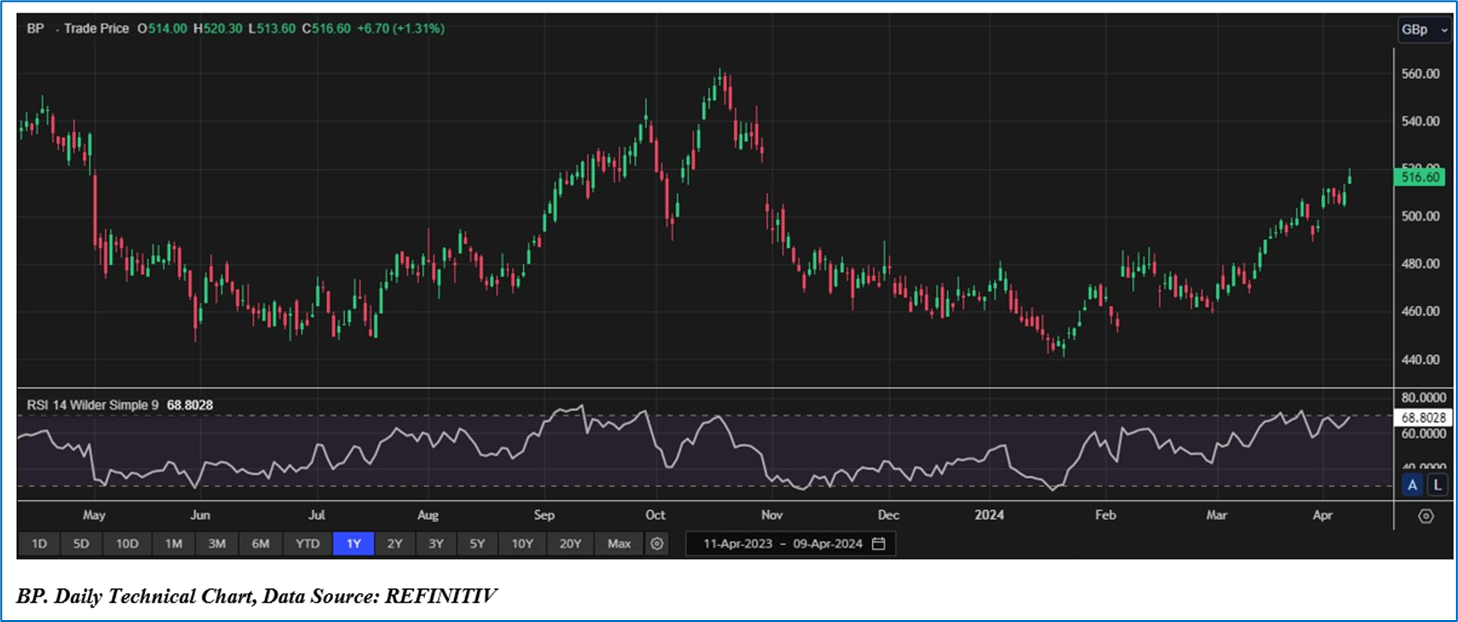
The stock experienced a gain of around 12.46% in the past three months but saw a slight decline of approximately 1.61% over the last six months. Its 52-week range spans from a low of GBX 441.05 to a high of GBX 562.30, and it's presently trading above the midpoint of this range.
Note 1: Past performance is not a reliable indicator of future performance.
Note 2: The reference data for all price data, currency, technical indicators, support, and resistance levels is 09 April 2024. The reference data in this report has been partly sourced from EODHD/Others.


 Please wait processing your request...