
Highlights
- Breedon Group reported a 6.7% year-on-year revenue increase to GBP 815.9 million in H1FY25.
- Interim dividend raised to GBX 4.75, maintaining a payout ratio of around 42%.
- Full-year underlying EBITDA is projected toward the lower end of consensus estimates.
Breedon Group PLC (LSE:BREE) is a United Kingdom-based construction materials company listed on the FTSE 250 index. The company operates as a vertically integrated supplier, providing a wide range of essential materials and solutions to the construction sector.
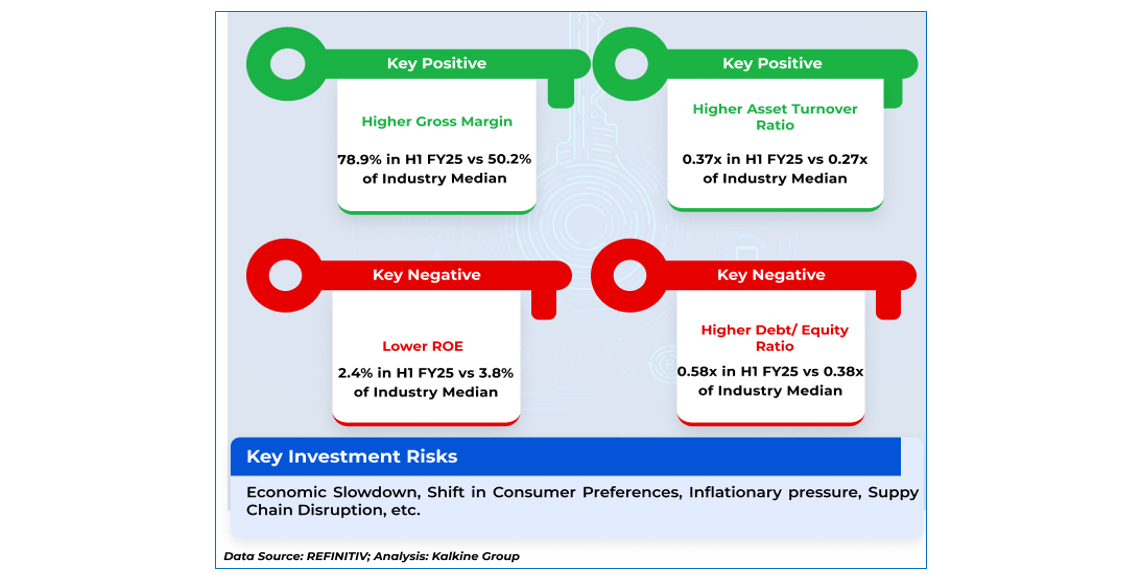
The company's first-half fiscal year 2025 (H1FY25) financial results showed a 6.7% year-on-year increase in revenue to GBP 815.9 million, driven mainly by the Lionmark acquisition and a full six-month contribution from BMC. However, the underlying EBITDA declined by 2.6% YoY and the underlying PBT fell by 20.1% YoY, reflecting softer like-for-like volumes and operating margin pressure in Great Britain and other regions.
Recent Business Update
In the recent business update, the interim dividend has been increased to GBX 4.75, reflecting a payout ratio of approximately 42% and was paid on 7 November 2025.
Company Outlook
The company now expects full-year underlying EBITDA to be at the low end of consensus (GBP 291.4m–GBP 311.5m), with indicative phasing of group revenue expected at 45:55 between the first and second half and group EBITDA split at 40:60. The company's forward strategy is supported by M&A pipeline and guidance for capital expenditures (GBP 125–135m), working capital outflow (GBP 20–30m), cash intere st (GBP 33m), and dividend payments (~GBP 52m). The covenant headroom and extended revolving credit facility offer additional flexibility for execution.
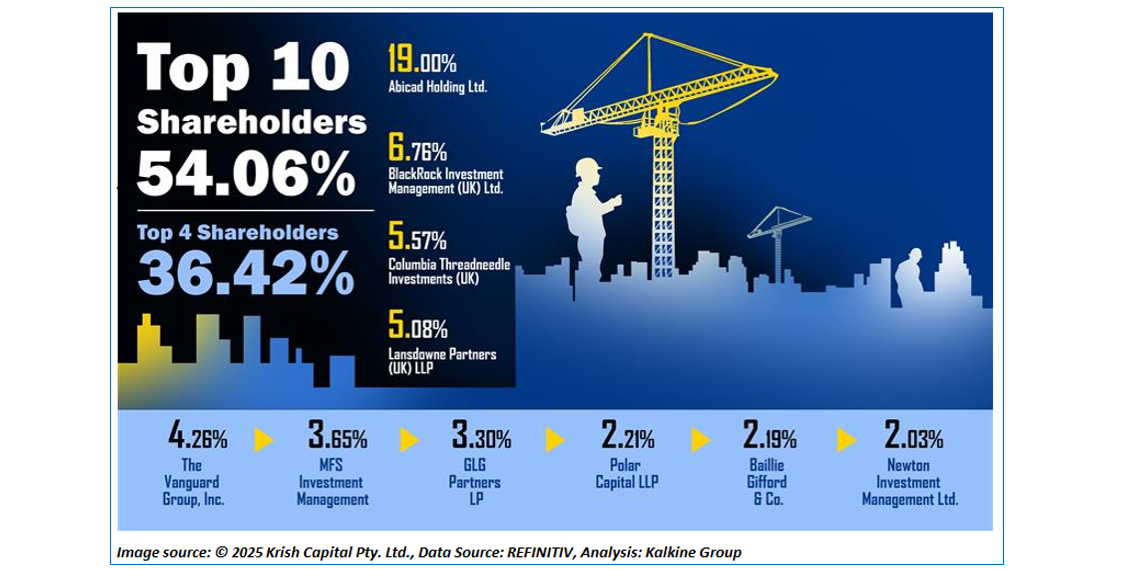
Top 10 Shareholders
As per the latest shareholding data, the top 10 shareholders collectively account for approximately 54.06% of the company’s total equity. Among them, Abicad Holding Ltd. holds the largest individual stake at around 19.00%, followed by BlackRock Investment Management (UK) Ltd. with about 6.76%.
Stock Information
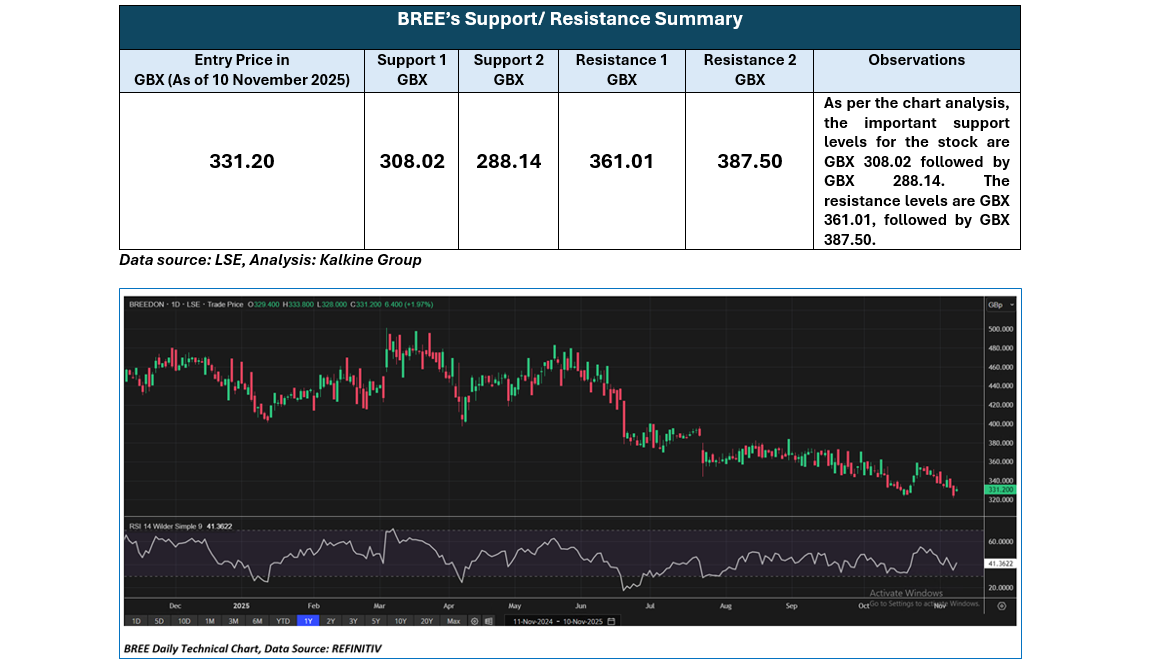
The stock has witnessed a plunge of ~11.69% and ~26.61% over the last 3 months and 6 months, respectively. Moreover, it is trading below the average of its 52-week high price of GBX 501.00 and the 52-week low price of GBX 321.80.
Note 1: Past performance is not a reliable indicator of future performance.
Note 2: The reference data for all price data, currency, technical indicators, support, and resistance levels is 10 November 2025. The reference data in this report has been partly sourced from EODHD/Others.
Technical Indicators Defined
Support: A level at which the stock prices tend to find support if they are falling, and a downtrend may take a pause backed by demand or buying interest. Support 1 refers to the nearby support level for the stock and if the price breaches the level, then Support 2 may act as the crucial support level for the stock.
Resistance: A level at which the stock prices tend to find resistance when they are rising, and an uptrend may take a pause due to profit booking or selling interest. Resistance 1 refers to the nearby resistance level for the stock and if the price surpasses the level, then Resistance 2 may act as the crucial resistance level for the stock.


 Please wait processing your request...