
Highlights
- Caledonia Mining Corporation’s Q3 FY25 revenue rose 52.6% year-on-year to USD 71.40 million
- Gross profit surged 90.7% to USD 36.80 million in Q3 FY25, as revenue growth outpaced cost of sales.
- Profit for the period climbed 481.3% year-on-year to USD 18.60 million, reflecting favourable operational leverage.
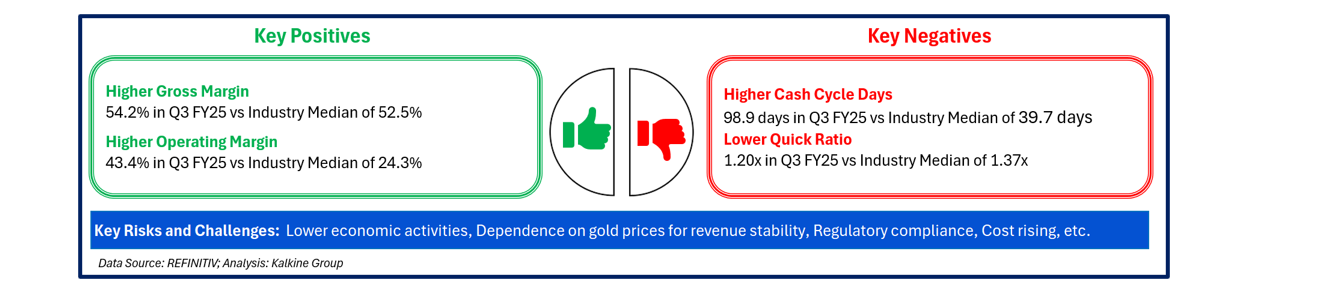
- Gross margin expanded to 54.20% in Q3 FY25 while operating margin improved to 43.40%.
- The company appointed Stanbic and CBZ as co-lead arrangers for a USD 150 million interim funding facility to advance the Bilboes project.
- Management remains focused on growth in Q4 FY25, supported by project execution at Bilboes and a stable liquidity position despite potential cost pressures.
Caledonia Mining Corporation (LSE:CMCL), a member of the FTSE AIM 100 Index, operates as a gold producer, developer, and exploration company with its core activities centred in Zimbabwe. The group owns a 64% stake in the producing Blanket Mine and retains full (100%) ownership of the Bilboes mine, as well as the Motapa and Maligreen gold exploration assets, all situated within Zimbabwe.
Financial Performance
In the third quarter of the fiscal year 2025 (Q3FY25), the company delivered a favourable improvement in profitability, supported by higher realised gold prices and improved operational efficiency. Gross margin expanded to 54.20% in Q3 FY25, compared with 43.50% in Q3 FY24, reflecting better cost absorption and favourable pricing. Operating margin also strengthened significantly to 43.40% in Q3 FY25, up from 19.60% in Q3 FY24, highlighting enhanced operational performance during the quarter.
On a financial basis, revenue rose to USD 71.40 million in Q3 FY25, compared with USD 46.80 million in Q3 FY24, representing a year-on-year increase of 52.6%. The growth was primarily driven by higher gold prices and increased sales volumes.
In line with revenue growth, gross profit increased to USD 36.80 million in Q3 FY25 from USD 19.30 million in Q3 FY24, marking a 90.7% year-on-year rise, as revenue expansion outpaced the increase in cost of sales.
Profitability improved markedly, with profit for the period reaching USD 18.60 million in Q3 FY25, compared to USD 3.20 million in Q3 FY24, reflecting a 481.3% year-on-year surge. The sharp increase was supported by favourable revenues amid firm gold prices and higher sales volumes.
Overall, the results for Q3 FY25 demonstrate substantial year-on-year growth in revenue and earnings, alongside meaningful margin expansion compared with Q3 FY24.
Recent Updates
On 23 February 2026, the company announced an Interim Funding Facility Update, highlighting the appointment of Stanbic and CBZ as co-lead arrangers for a USD 150 million financing facility. This development represents a key step forward in the company’s funding strategy and is intended to support the advancement of the Bilboes gold project. The facility, which is targeted for completion by mid-2026, is expected to strengthen financial flexibility alongside existing resources and support the company’s broader growth objectives.
Company Outlook
For Q4 FY25, management indicates that the company remains positioned for growth, with the Bilboes feasibility study approaching completion and interim funding progressing. While elevated costs may exert near-term margin pressure, ongoing strategic investments at Blanket and disciplined project execution are anticipated to support longer-term profitability. The outlook is underpinned by a stable liquidity position.
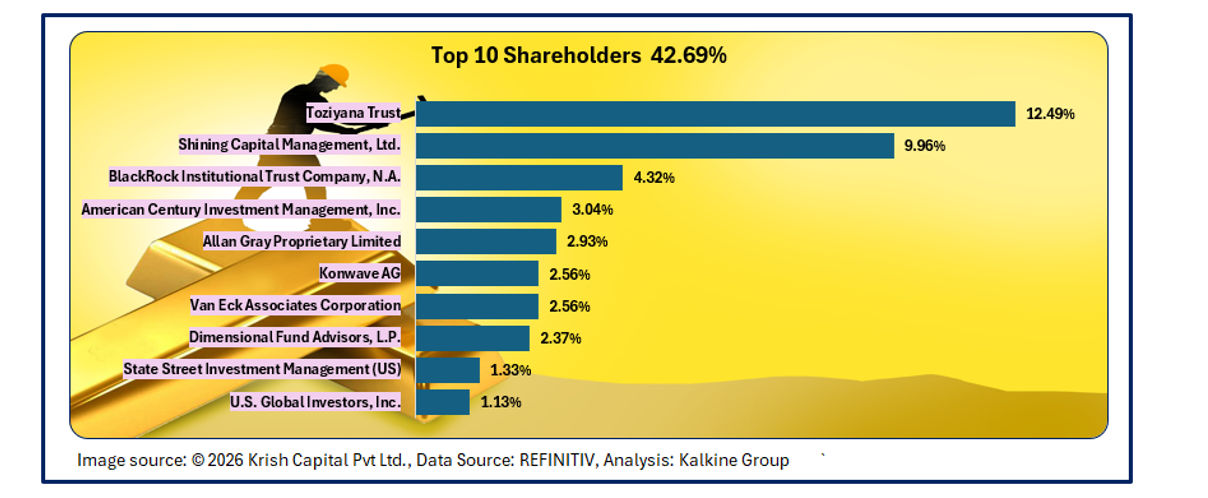
Top 10 Shareholders
The top 10 shareholders collectively own about ~42.69% of the company's total shares. Toziyana Trust and Shining Capital Management, Ltd. hold a maximum stake in the company at ~12.49% and ~9.96%, respectively.
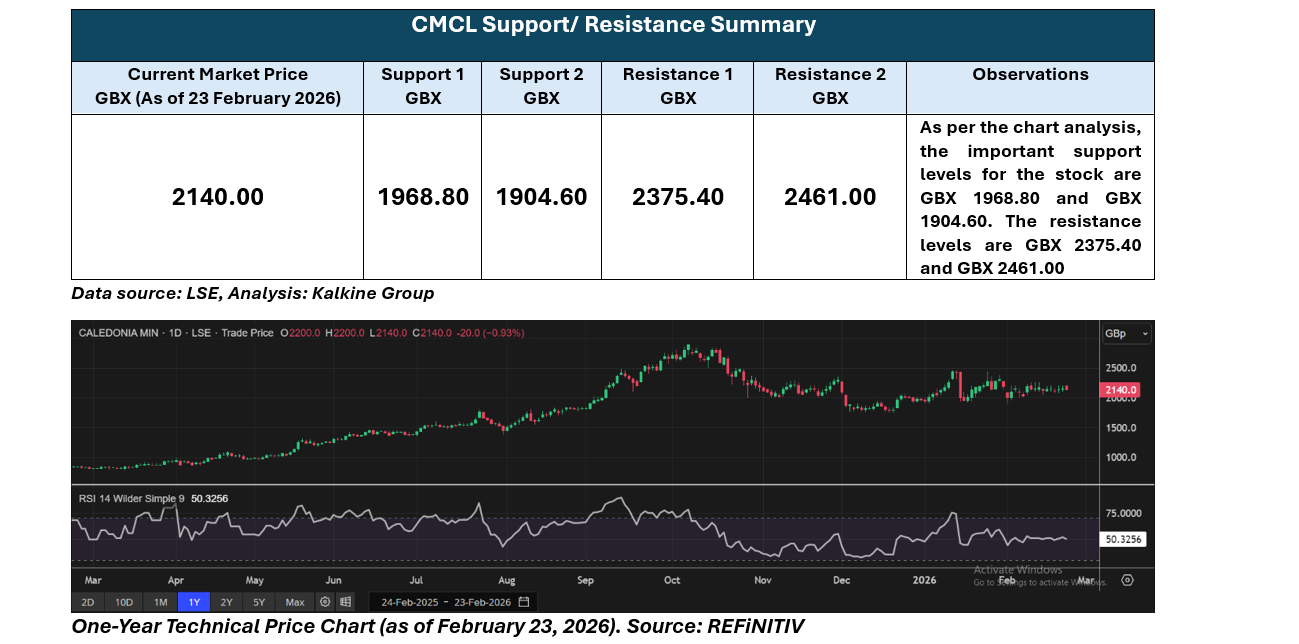
Stock Information
CMCL stock price has increased by ~1.40% over the last week while gaining approximately ~5.88% over the last three months. The stock has a 52-week high and 52-week low of GBX 2900.00 and GBX 785.00, respectively and is currently trading above the average of 52-week high-low level.
Note 1: Past performance is not a reliable indicator of future performance.
Note 2: The reference data for all price data, currency, technical indicators, support, and resistance levels is 23 February 2026. The reference data in this report has been partly sourced from EODHD/Others.
Technical Indicators Defined
Support: A level at which the stock prices tend to find support if they are falling, and a downtrend may take a pause backed by demand or buying interest. Support 1 refers to the nearby support level for the stock and if the price breaches the level, then Support 2 may act as the crucial support level for the stock.
Resistance: A level at which the stock prices tend to find resistance when they are rising, and an uptrend may take a pause due to profit booking or selling interest. Resistance 1 refers to the nearby resistance level for the stock and if the price surpasses the level, then Resistance 2 may act as the crucial resistance level for the stock.


 Please wait processing your request...