
Highlights
- CAML’s H1FY25 revenue stood at USD 99.5 million, down 2.4% year-over-year amid lower metal grades and sales timing
- EBITDA declined 22.6% to USD 39.94 million due to inflationary costs, FX impact, and higher operating expenses.
- Profit for the period dropped 59.9% to USD 8.77 million, reflecting increased concession fees and depreciation.
- CAML launched a USD 10 million share buyback in September 2025 to return capital to shareholders.
Central Asia Metals PLC (LSE:CAML) is a diversified metals producer listed on the FTSE AIM UK 50 Index, focusing on copper operations in Kazakhstan and zinc-lead production in North Macedonia.
For the first half of the financial year 2025 (H1FY25), CAML’s revenue was USD 99.5 million, down 2.4% year-over-year due to lower zinc and lead head grades at Sasa and copper sales timing at Kounrad. EBITDA came in at USD 39.94 million, a 22.6% decrease, attributed to inflation-linked salary rises, higher operating costs from new Sasa plants, and unfavorable FX movements on USD reporting. Profit for the period dropped sharply by 59.9% to USD 8.77 million, impacted by higher concession fees, energy tariffs, and asset depreciation.
Recent Business Update
On September 10, 2025, the company announced the initiation of a USD 10 million share buyback program. The plan involves repurchasing USD 0.01 ordinary shares for up to an aggregate of USD 10 million from the announcement date, aiming to reduce the company’s share capital and return capital to shareholders who participate.
Company Outlook
The company projects optimistic output for 2025, with Kounrad expecting 13,000–14,000 tonnes of copper, and Sasa targeting 17,000–19,000 tonnes of zinc and 25,000–27,000 tonnes of lead. Strategic priorities for the second half of the year include improving orebody modelling and productivity to stabilize grade variability. Following the NWR disposal, the proceeds have strengthened liquidity and enabled a 4.5p interim dividend and a USD 10 million share buy-back program while supporting organic growth
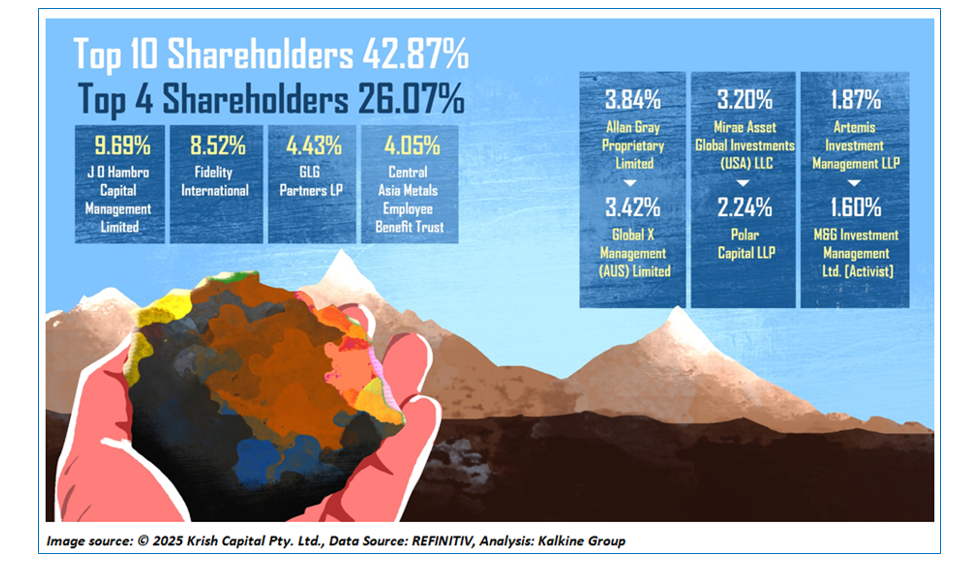
Top 10 Shareholders
The top ten shareholders jointly account for nearly 42.87% of the company’s total shareholding. J O Hambro Capital Management Limited holds the largest position at approximately 9.69%, followed by Fidelity International at about 8.52%.
Stock Information
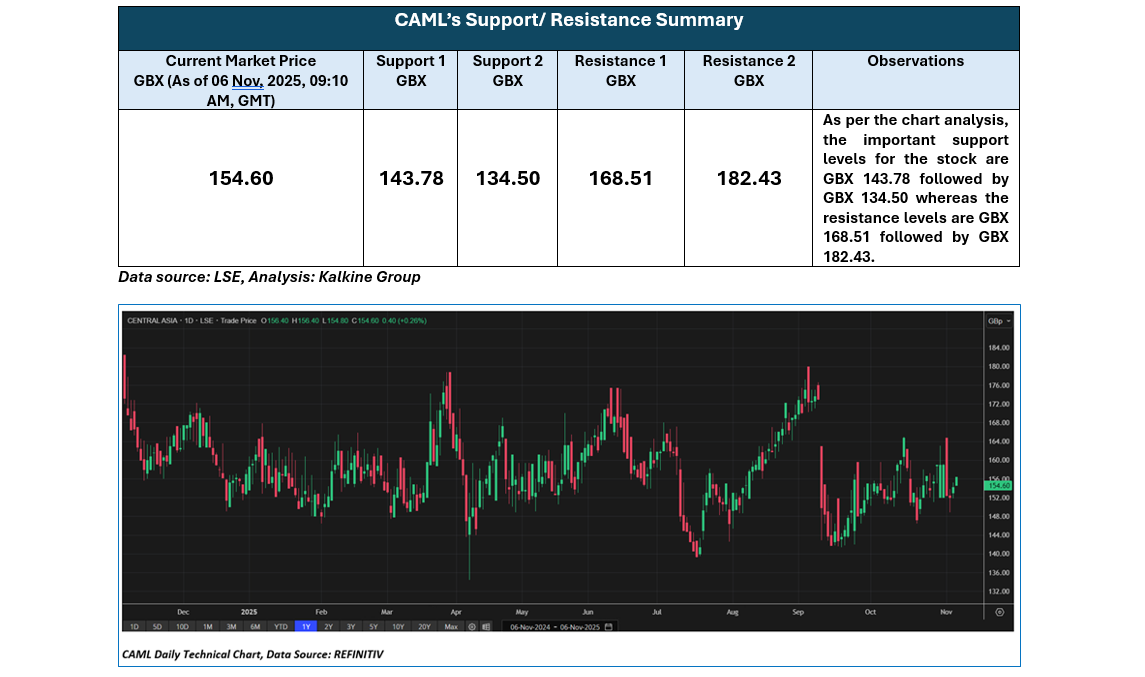
The stock has shown moderate gains, appreciating by about 0.12% over the past three months and nearly 1.18% in the last six months. It currently trades below the average of its 52-week high and low, which stand at GBX 186.40 and GBX 134.45, respectively.
Note 1: Past performance is not a reliable indicator of future performance.
Note 2: The reference data for all price data, currency, technical indicators, support, and resistance levels is 06 Nov 2025. The reference data in this report has been partly sourced from EODHD/Others.
Technical Indicators Defined
Support: A level at which the stock prices tend to find support if they are falling, and a downtrend may take a pause backed by demand or buying interest. Support 1 refers to the nearby support level for the stock and if the price breaches the level, then Support 2 may act as the crucial support level for the stock.
Resistance: A level at which the stock prices tend to find resistance when they are rising, and an uptrend may take a pause due to profit booking or selling interest. Resistance 1 refers to the nearby resistance level for the stock and if the price surpasses the level, then Resistance 2 may act as the crucial resistance level for the stock.


 Please wait processing your request...