_11_04_2025_16_12_24_993604.png)
Highlights
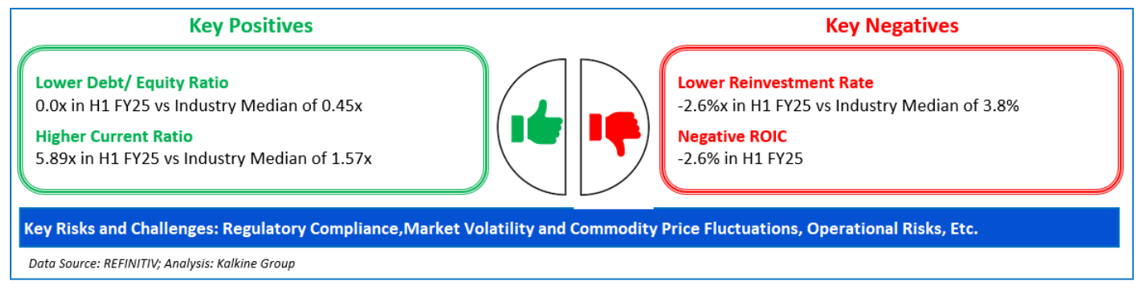
- Cora Gold’s updated DFS for Sanankoro Gold Project indicates a 65% IRR and USD 221 million NPV at a gold price of USD 2,750/oz.
- H1 FY2025 pre-tax loss widened to USD 0.68 million due to higher administrative and technical expenses.
- The company is advancing toward Front-End Engineering and Design as it prepares for construction planning in 2025.
Cora Gold Ltd (LSE:CORA) is a UK-based mining royalty company listed on the FTSE AIM All-Share. The company is primarily focused on advancing its flagship Sanankoro Gold Project in southern Mali, alongside ongoing regional exploration activities across Mali and Senegal.
In the first half of financial year 2025 (H1 FY2025), Cora Gold reported overhead costs of USD 0.69 million, up from USD 0.62 million in H1FY2024, primarily due to additional administrative and technical expenses linked to progressing the updated Definitive Feasibility Study (DFS) for Sanankoro and enhancing corporate governance. The company recorded a pre-tax loss of USD 0.68 million compared to USD 0.46 million a year earlier, reflecting higher administrative spending and lower interest income. Cash and cash equivalents stood at USD 1.64 million, down 20.8% year-on-year, largely influenced by the GBP 1.55 million (USD 2.0 million) equity raise completed in April 2025.
Recent Business Update
On September 3, 2025, Cora Gold announced updated reserves and a Definitive Feasibility Study for its Sanankoro Gold Project. The DFS outlined a probable reserve of 531 koz at 1.13 g/t, reflecting a significant improvement from previous estimates. Based on a gold price of USD 2,750/oz, the project demonstrates a robust 65% IRR, a payback period of 1.1 years, and an NPV of USD 221 million, with life-of-mine free cash flow projected at USD 479 million. Operating metrics include a life-of-mine cash cost of USD 948/oz and an AISC of USD 1,478/oz over a 10.2-year mine life, averaging 47 koz per annum.
The project will utilize a 1.5 Mtpa CIL plant with solar-hybrid power integration expected to reduce fuel consumption by about 40 million litres over the mine life. Additionally, growth opportunities remain through oxide-first mining, potential resource conversion of 173 koz, and 19 nearby exploration targets within 3–4 km of the plant.
Company Outlook
The company’s updated Definitive Feasibility Study, which integrates the 2024 Mineral Resource Estimate and project optimisation work, remains on schedule for completion in Q3 2025. The study is anticipated to deliver stronger project economics, supported by the higher prevailing gold prices compared to the USD 1,750/oz base used in the 2022 assessment. Following sterilisation drilling at the proposed plant site in July 2025, the company plans to advance to Front-End Engineering and Design, marking a key step toward transitioning from technical studies to construction planning.
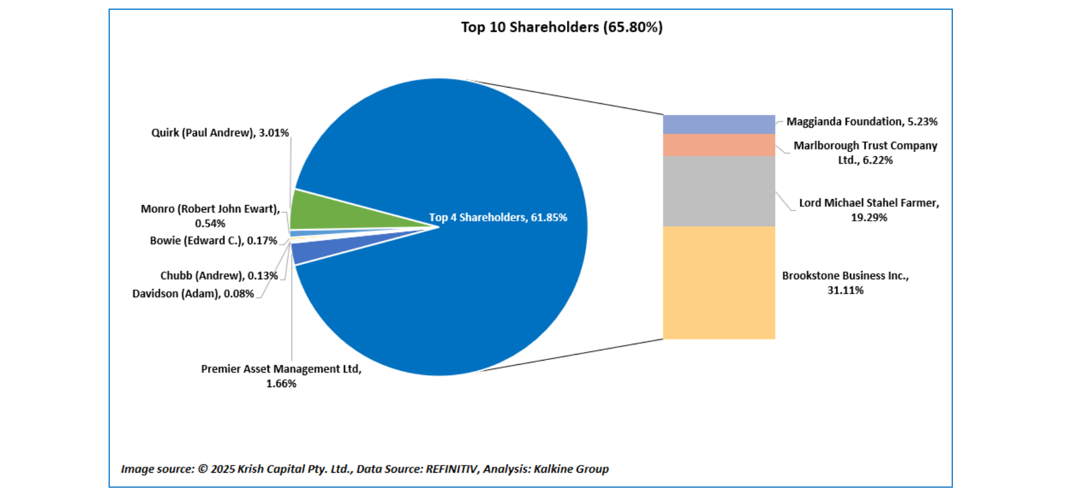
Top Shareholders
The top 10 shareholders collectively hold approximately 65.80% of Cora Gold’s total shareholding, with Brookstone Business Inc. and Lord Michael Stahel Farmer being the largest shareholders, owning around 31.11% and 19.29%, respectively.
Stock Information
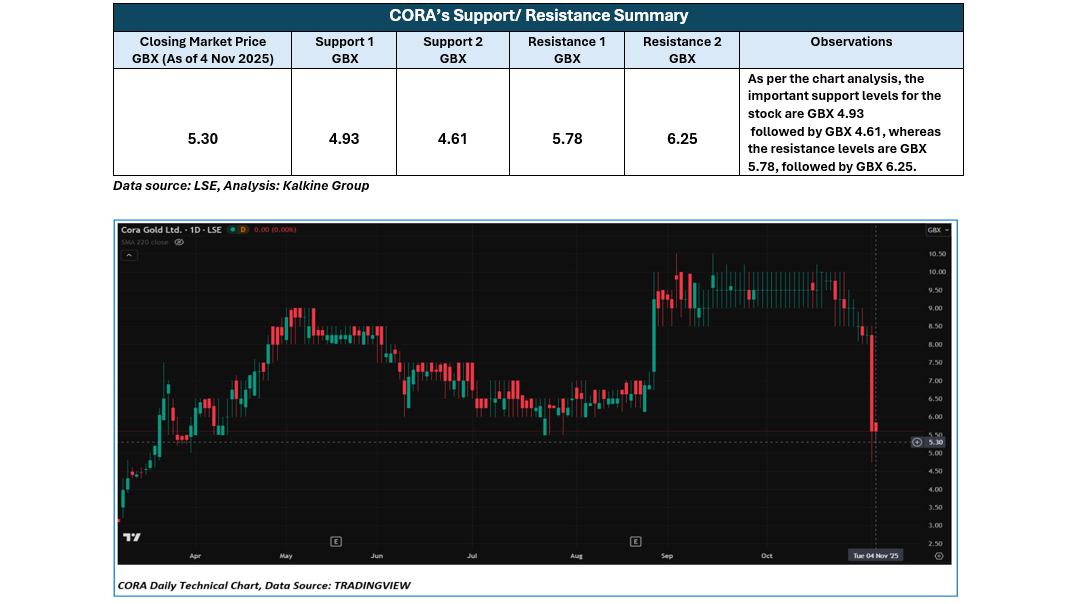
The stock has declined by approximately 13.84% over the past three months and around 34.11% over the past six months. It has traded between a 52-week low of GBX 2.10 and a high of GBX 10.50, currently positioned below the average of 52-week high-low.
Note 1: Past performance is not a reliable indicator of future performance.
Note 2: The reference data for all price data, currency, technical indicators, support, and resistance levels is 04 November 2025. The reference data in this report has been partly sourced from EODHD/Others.
Technical Indicators Defined
Support: A level at which the stock prices tend to find support if they are falling, and a downtrend may take a pause backed by demand or buying interest. Support 1 refers to the nearby support level for the stock and if the price breaches the level, then Support 2 may act as the crucial support level for the stock.
Resistance: A level at which the stock prices tend to find resistance when they are rising, and an uptrend may take a pause due to profit booking or selling interest. Resistance 1 refers to the nearby resistance level for the stock and if the price surpasses the level, then Resistance 2 may act as the crucial resistance level for the stock.


 Please wait processing your request...