
Highlights
- Dowlais Group’s H1FY24 revenue declined 9.2%, driven by ePowertrain challenges.
- Free cash flow decreased by 69.7% YoY in H1FY24, reflecting lower earnings and higher costs.
- Adjusted revenue is expected to fall mid-to-high single digits in FY24.
Dowlais Group PLC (LSE:DWL) is an engineering firm listed on the FTSE 250. The UK-based company has a major focus on the automotive industry. Its main divisions include Automotive, Powder Metallurgy, and Hydrogen.
In the first half of the financial year 2024 (H1FY24), the company reported adjusted revenue of GBP 2,571 million, a decline of 9.2% compared to GBP 2,830 million in H1FY23, primarily driven by weakness in the Automotive ePowertrain product line. Despite this, key segments such as Driveline, China, and Powder Metallurgy, which collectively account for over 75% of group revenue, outperformed their respective markets.
Free cash flow also decreased significantly by 69.7%, falling from GBP 33 million in H1 FY23 to GBP 10 million in H1 FY24. This reduction was primarily due to lower earnings, higher interest costs, and restructuring expenses. As a result, net debt increased to GBP 915 million from GBP 847 million at the end of the previous fiscal year, with leverage rising to 1.6x from 1.4x.
Company Outlook
Driveline, China, and Powder Metallurgy outperformed the market. However, ePowertrain saw a 5.1% revenue decline due to BEV production volatility. Light vehicle production is expected to drop by 2% in 2024. As a result, adjusted revenue is projected to decline by mid-to-high single digits, with an operating margin of 6.0%-7.0%. Free cash flow will decrease due to lower volumes and restructuring costs.
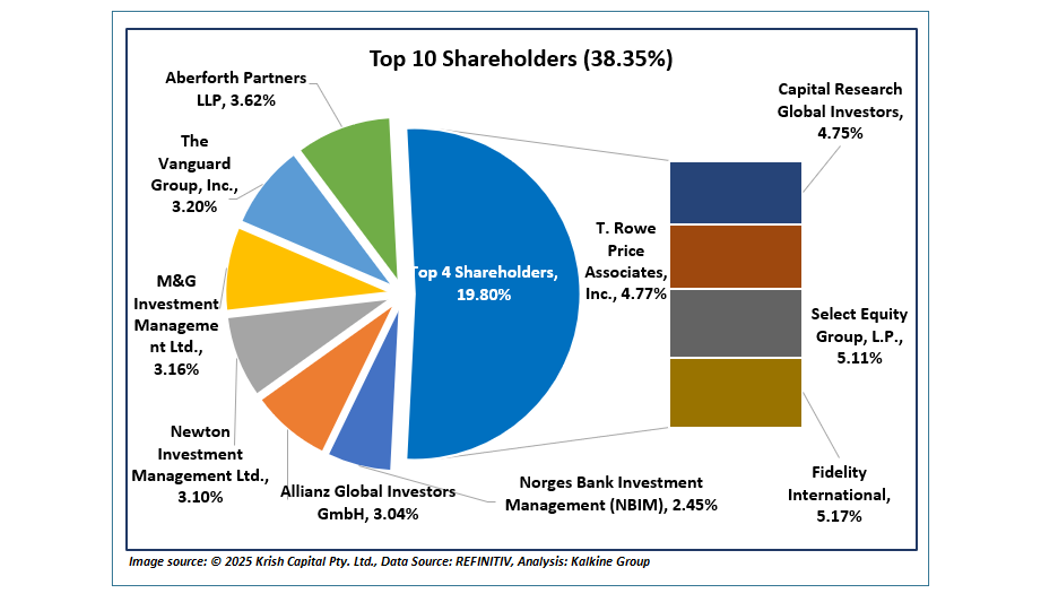
Top 10 Shareholders
The 10 largest shareholders together account for approximately 38.35% of the total shares. Fidelity International holds the highest proportion, owning about 5.17% of the shares, while Select Equity Group, L.P. follows closely with around 5.11%, as shown in the chart below.
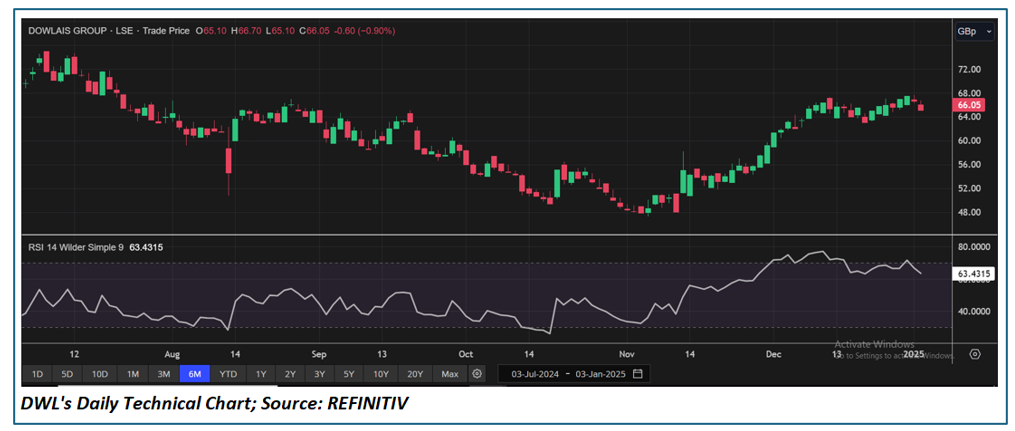
Stock Performance
The stock has increased by approximately 4.59% over the past month, but it has fallen around 10.50% over the last six months. Its 52-week range is from a low of GBX 47.32 to a high of GBX 109.15, and it is currently trading below the average of this range.
Note 1: Past performance is not a reliable indicator of future performance.
Note 2: The reference data for all price data, currency, technical indicators, support, and resistance levels is 03 January 2024. The reference data in this report has been partly sourced from EODHD/Others.


 Please wait processing your request...