
Image source: Shutterstock
Highlights
- ELIX achieved GBP 53 million in revenue for H1FY24, reflecting a 27.4% YoY growth
- The company’s full-year results for FY24 are scheduled to be released on 28 April 2025
- ELIX expects FY24 results to surpass market expectations, with revenue exceeding GBP 111 million and adjusted EBITDA of approximately GBP 31 million
- The company’s board projects FY24 EBITDA margin within 27-29%
Elixirr International PLC (LSE:ELIX) is a global consulting firm that partners with clients across various industries, markets, and regions. It has a market cap of GBP 374.15mn.
In the first half of the financial year 2024 (H1FY24), ELIX achieved a revenue of GBP 53 million, marking a 27.4% year-on-year growth compared to GBP 41.6 million in H1FY23. This growth was driven by four record-breaking months, with organic revenue increasing by 14%. Of this growth, GBP 4.1 million came from existing clients, while GBP 6.4 million stemmed from new clients.
ELIX’s net cash position also saw a significant improvement in H1FY24, rising by 13.3% YoY to GBP 22.1 million from GBP 19.5 million in H1FY23. The increase was primarily driven by higher operating cash flow from EBITDA growth and better-working capital management. However, this was partially offset by a GBP 2.5 million interim dividend paid in February 2024 for FY 2023.
Recent Business Update
On 11 March 2025, ELIX announced that its full-year results for the year ending 31 December 2024 would be published on 28 April 2025.
Company Outlook
The company’s board is confident in the FY24 outlook, projecting revenue to surpass GBP 111 million. The company expects its full-year EBITDA margin to fall within the 27-29% range with adjusted EBITDA of nearly GBP 31 million.
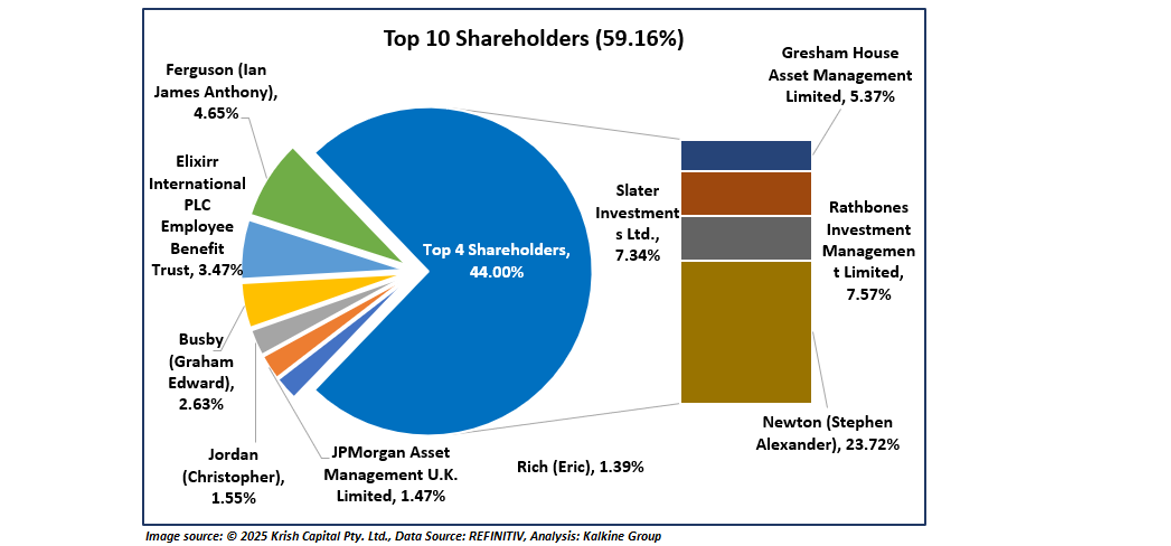
Top 10 Shareholders
The top 10 shareholders of ELIX collectively hold approximately 59.16% of the company’s total shares. Newton (Stephen Alexander) holds the largest stake with around 23.72%, followed by Rathbones Investment Management Limited with approximately 7.57%, as shown in the chart below.
Stock Information
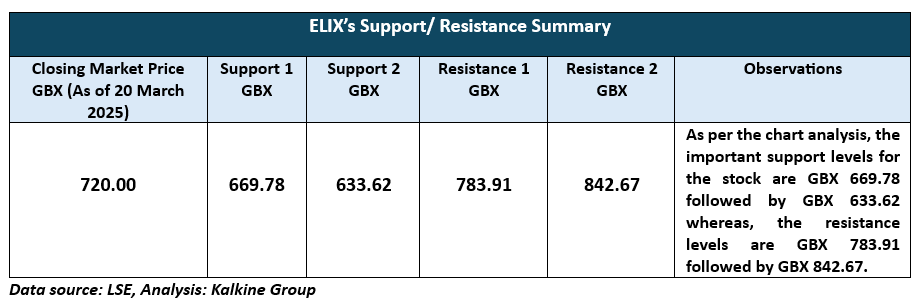
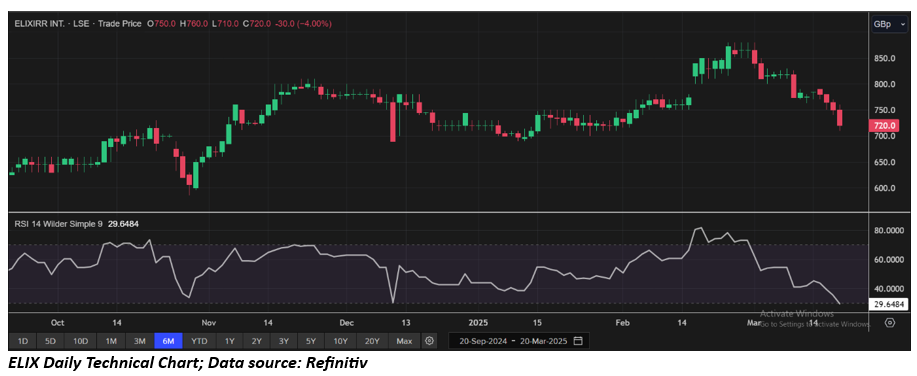
The stock has experienced a decline of approximately 14.28% over the past month and a notable increase of around 15.20% over the last six months. With a 52-week low of GBX 520.00 and a high of GBX 880.00, the stock is currently trading above the average of these two values, closing at GBX 720.00 as of 20 March 2025.
Note 1: Past performance is not a reliable indicator of future performance.
Note 2: The reference data for all price data, currency, technical indicators, support, and resistance levels is 20 March 2025. The reference data in this report has been partly sourced from EODHD/Others.
Technical Indicators Defined
Support: A level at which the stock prices tend to find support if they are falling, and a downtrend may take a pause backed by demand or buying interest. Support 1 refers to the nearby support level for the stock and if the price breaches the level, then Support 2 may act as the crucial support level for the stock.
Resistance: A level at which the stock prices tend to find resistance when they are rising, and an uptrend may take a pause due to profit booking or selling interest. Resistance 1 refers to the nearby resistance level for the stock and if the price surpasses the level, then Resistance 2 may act as the crucial resistance level for the stock.


 Please wait processing your request...