Image source: Shutterstock
Highlights
- Endeavour Mining reported a 26.5% YoY increase in FY24 revenue to USD 2,676mn
- Adjusted EBITDA for FY24 rose 26.6% YoY to USD 1,325mn, driven by cost optimization
- Q4FY24 Adjusted EBITDA surged 72% QoQ to USD 546mn, fueled by higher production
- Endeavour reaffirmed its FY25 production guidance of 1,110-1,260koz with a focus on cost efficiency
Endeavour Mining PLC (LSE:EDV) is a gold producer with a portfolio of gold mines in Western Africa.
For the financial year 2024 (FY24), the company reported a 26.5% YoY increase in revenue, reaching USD 2,676 million, driven by a 22% rise in realised gold prices to USD 2,349/oz and higher gold sales of 1,099koz. Adjusted EBITDA also saw a 26.6% YoY increase, rising to USD 1,325 million, supported by cost optimisation and higher gold prices.
Notably, Q4FY24 adjusted EBITDA surged 72% quarter-on-quarter (QoQ) to USD 546 million, reflecting higher production at Houndé and Ity, coupled with lower all-in sustaining costs (AISC).
Recent Business Update
For FY24, the company achieved notable ESG performance, maintaining top-tier ratings from Sustainalytics and MSCI, reflecting its commitment to responsible mining and sustainability. Exploration efforts resulted in a 12.2Moz increase in M&I resources at an average cost of USD 25/oz. Operationally, the Lafigué and Sabodala-Massawa BIOX expansion projects were delivered on time and on budget, enhancing efficiency and production.
Company Outlook
The company reaffirmed its FY25 production guidance of 1,110-1,260koz at an AISC of USD 1,150-1,350/oz, focusing on cost optimisation and efficiency, particularly at low-cost mines like Ity and Lafigué. Capital expenditures are projected at USD 215mn for sustaining and non-sustaining investments, with growth capital reducing to USD 10mn.
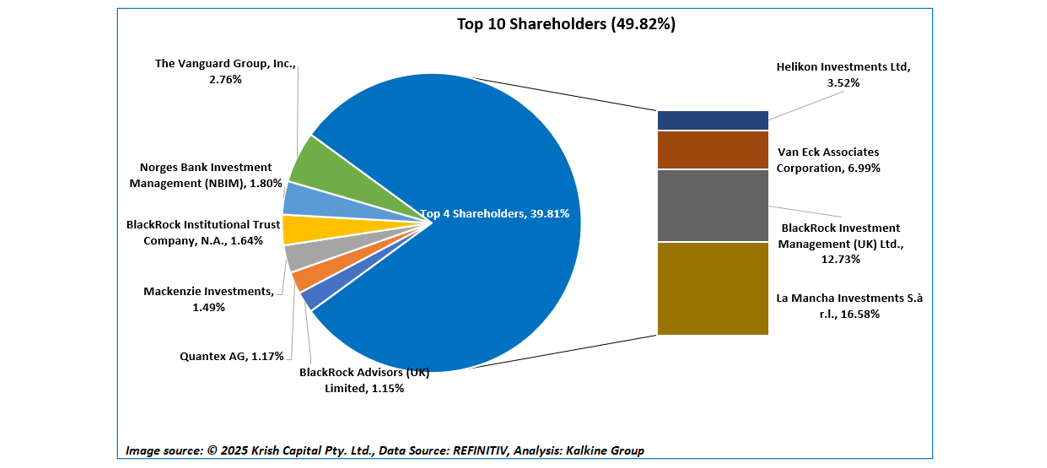
Top 10 Shareholders
The top 10 shareholders of Endeavour Mining account for approximately 49.82% of the company's total shares. Leading the list is La Mancha Investments S.à r.l., holding around 16.58% of the shares, closely followed by BlackRock Investment Management (UK) Ltd. with about 12.73% ownership.
Stock Information
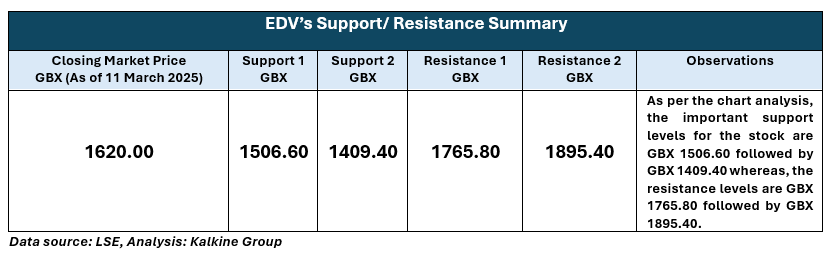
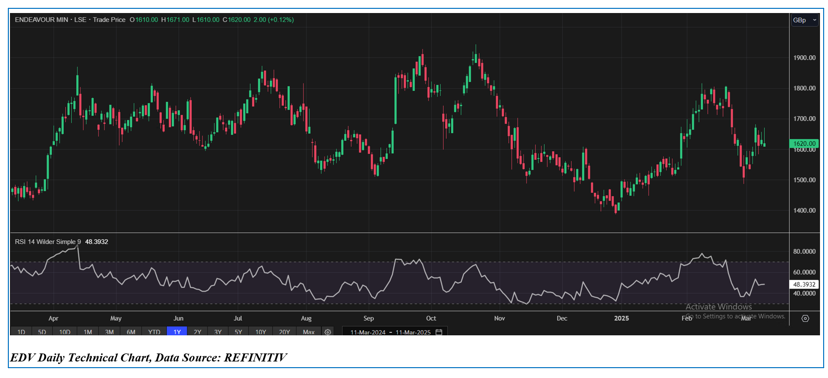
The stock has experienced an ~8.00% rise over the past three months and a ~2.14% increase over the last six months. It has a 52-week low of GBX 1,387.00 and a 52-week high of GBX 1,944.00. Currently, the stock is trading below its 52-week high-low average, with a closing price of GBX 1,620.00 as of 11 March 2025.
Note 1: Past performance is not a reliable indicator of future performance.
Note 2: The reference data for all price data, currency, technical indicators, support, and resistance levels is 11 March 2025. The reference data in this report has been partly sourced from EODHD/Others.
Technical Indicators Defined
Support: A level at which the stock prices tend to find support if they are falling, and a downtrend may take a pause backed by demand or buying interest. Support 1 refers to the nearby support level for the stock and if the price breaches the level, then Support 2 may act as the crucial support level for the stock.
Resistance: A level at which the stock prices tend to find resistance when they are rising, and an uptrend may take a pause due to profit booking or selling interest. Resistance 1 refers to the nearby resistance level for the stock and if the price surpasses the level, then Resistance 2 may act as the crucial resistance level for the stock.


 Please wait processing your request...