
Highlights
- Energean’s H1 FY25 revenue declined 7.2% year-on-year to USD 803.78 million in H1 FY25.
- Profit after tax increased 24.8% to USD 110.48 million in H1 FY25, driven by improved cost control and operational efficiencies.
- Key development projects, including Katlan and Irena, target first gas in H1 2027, while the Egypt merger concession is nearing completion.
- Exploration activity is set to accelerate in 2026, alongside disciplined cost management and selective M&A evaluation in West Africa.
Energean plc (LSE:ENOG) is a constituent of the FTSE 250 index and operates as an independent exploration and production company focused on oil and gas assets. The group maintains a geographically diversified portfolio spanning the Mediterranean basin and the UK North Sea, with activities ranging from producing fields to development-stage and exploration projects.
The company reports its operations across four core segments: Europe (including Greece, Italy, the UK, and Croatia), Israel, Egypt, and New Ventures. Within Greece, its principal holdings comprise the Prinos Concession, Prinos CO₂ project, South Kavala field, Katakolo asset, and Block 2 exploration area, forming a central pillar of its European operations.
Financial Performance
During H1 FY25 (ended 30 June 2025), the company reported revenue of USD 803.78 million, reflecting a 7.2% decline compared to USD 866.59 million in H1 FY24. Despite the lower top line in H1 FY25, profitability strengthened considerably, supported by improved cost control and operational efficiencies.
Gross profit in H1 FY25 stood at USD 334.70 million, marking a 17.5% decrease from USD 405.70 million in H1 FY24, broadly in line with the contraction in revenue during the period. However, bottom-line performance showed notable resilience.
Profit after tax rose to USD 110.48 million in H1 FY25, registering a 24.8% increase from USD 88.53 million in H1 FY24, driven by a sharp improvement in margins and enhanced operating efficiency.
Margin trends further reinforced this improvement. Operating margin expanded to 65.4% in H1 FY25, up from 64.7% in H1 FY24 and 62.1% in H1 FY23, reflecting sustained operational discipline. Net margin climbed to 13.7% in H1 FY25, compared with 10.2% in H1 FY24 and 7.3% in H1 FY23, underscoring favourable bottom-line conversion despite softer revenues.
Overall, while revenue moderated in H1 FY25, disciplined cost management and efficiency gains translated into materially higher profitability and improved margin performance on a year-on-year basis.
Company Outlook
Looking ahead, the company continues to prioritise disciplined execution across its core growth projects. Management is progressing the Katlan and Irena developments with a target of achieving first gas in H1 2027, while also advancing the Egypt merger concession, which is expected to be finalised by the end of the current quarter.
Exploration activity is also set to accelerate. A multi-well drilling programme is scheduled to commence with onshore Egypt operations in Q2 2026, followed by the high-impact Block 2 offshore Greece campaign in late 2026.
At the same time, the company remains focused on maintaining strict cost discipline, pursuing targeted cost reductions to protect margins. Management is additionally evaluating selective M&A opportunities in West Africa to further optimise and strengthen the core asset base while maintaining financial prudence.
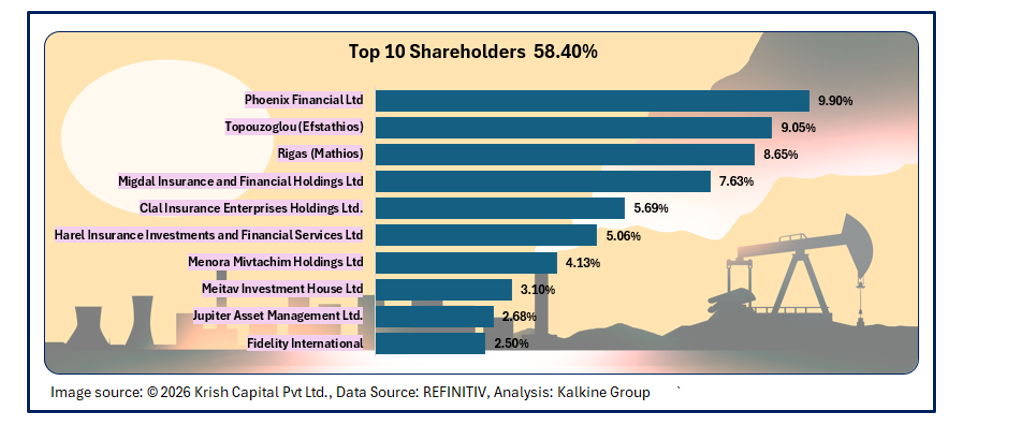
Top 10 Shareholders
The top 10 shareholders collectively own about ~58.40% of the company's total shares. Phoenix Financial Ltd and Topouzoglou (Efstathios) hold maximum stakes in the company at ~9.90% and ~9.05%, respectively.
Stock Information
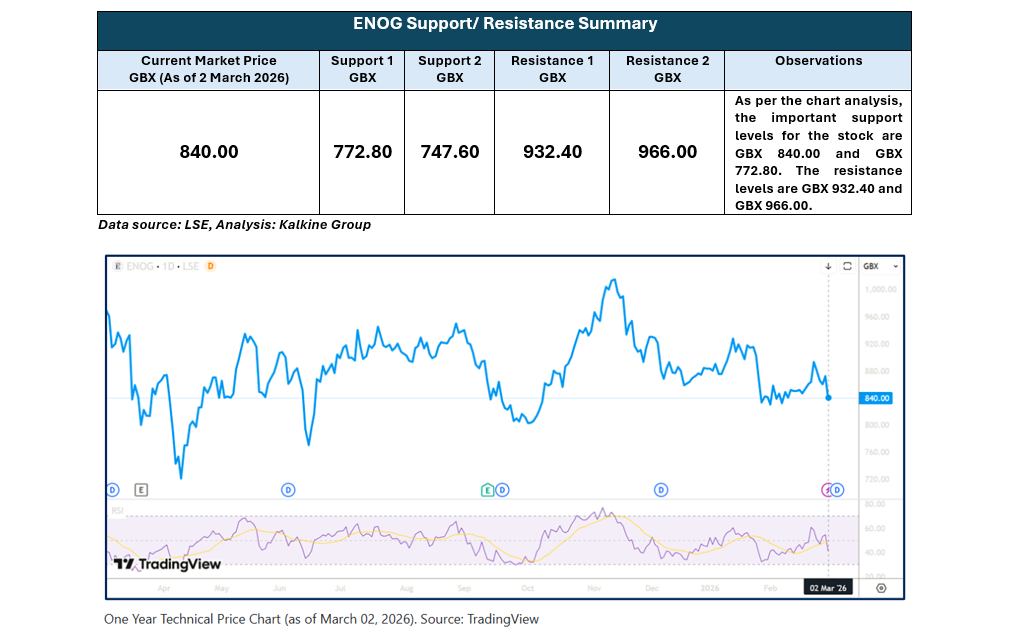
ENOG has increased by ~1.59% over the last week while gaining approximately ~4.89% over the last three months. The stock has a 52-week high and 52-week low of GBX 1042.00 and GBX 720.50, respectively, and is currently trading below the average of the 52-week high-low level.
Note 1: Past performance is not a reliable indicator of future performance.
Note 2: The reference data for all price data, currency, technical indicators, support, and resistance levels is 2 March 2026. The reference data in this report has been partly sourced from EODHD/Others.
Technical Indicators Defined
Support: A level at which the stock prices tend to find support if they are falling, and a downtrend may take a pause backed by demand or buying interest. Support 1 refers to the nearby support level for the stock and if the price breaches the level, then Support 2 may act as the crucial support level for the stock.
Resistance: A level at which the stock prices tend to find resistance when they are rising, and an uptrend may take a pause due to profit booking or selling interest. Resistance 1 refers to the nearby resistance level for the stock and if the price surpasses the level, then Resistance 2 may act as the crucial resistance level for the stock.


 Please wait processing your request...