
Image source: Pexels.com
Highlights
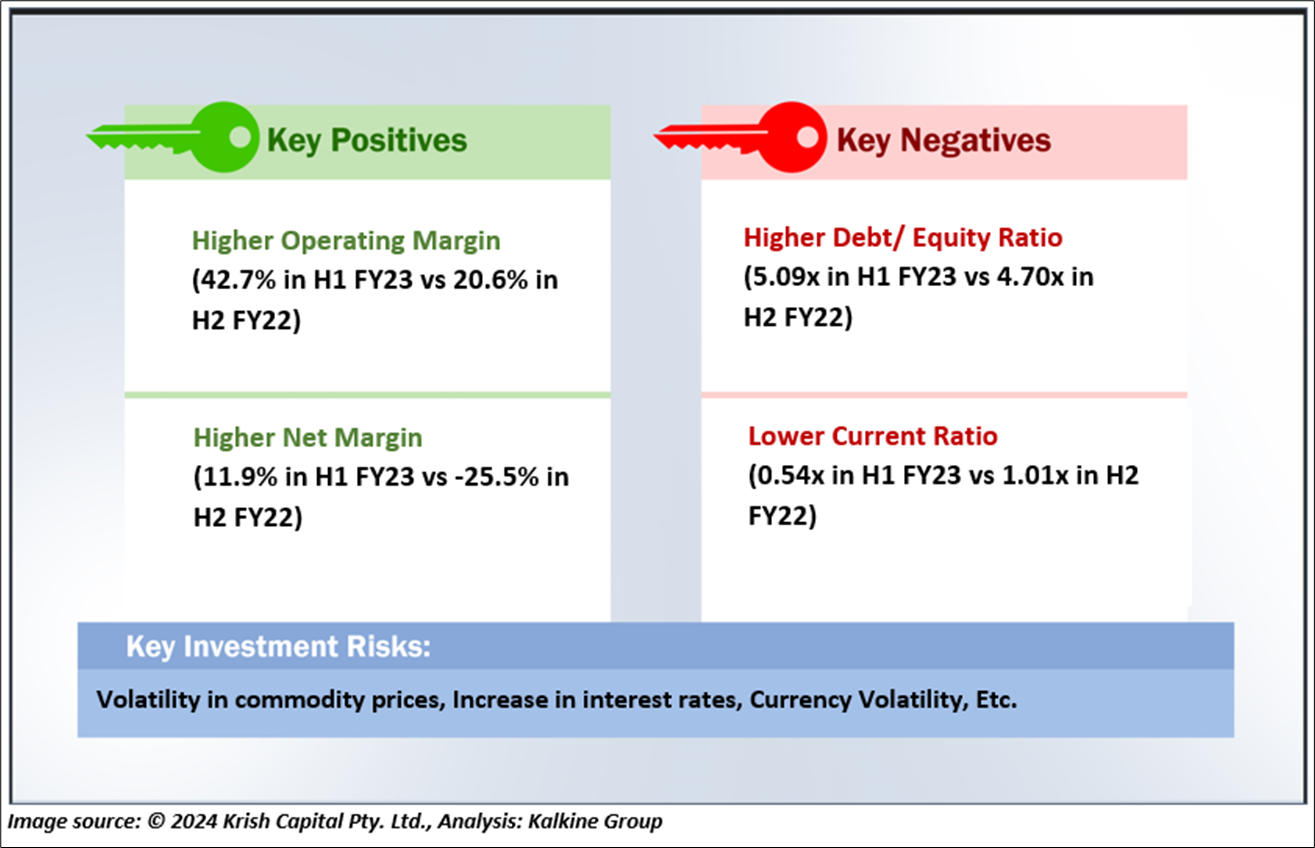
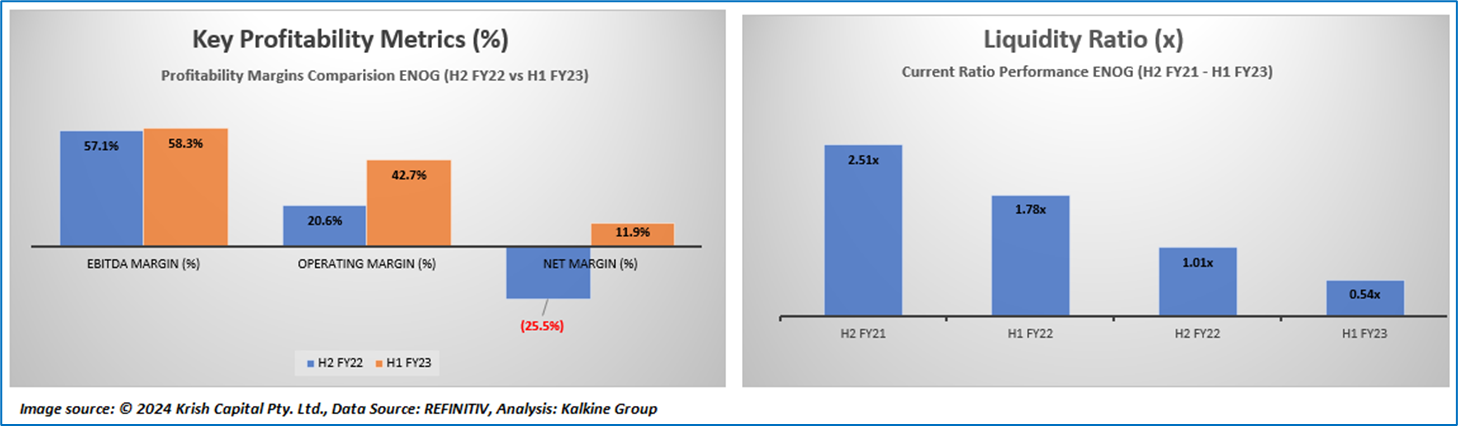
- Energean recorded total production of 123 kboed in FY23, marking a 200% jump over 42 kboed in pcp.
- There was a 44% drop in the cash cost of production to USD 10.6/boe in FY23, from USD 18.9/boe in FY22.
- ENOG’s sales and other revenue rose by about 93% to USD 1,419 million in the reporting period, versus USD 737 million in FY22.
FTSE 250 listed Energean PLC (LSE: ENOG) is a hydrocarbon exploration and production entity. Currently, ENOG has its operations across eight countries in the Mediterranean and the United Kingdom North Sea. With its focus centered on production and development of energy with a low carbon footprint, the company invests and builds new ideas, concepts, and solutions.
For the full fiscal year 2023, Energean posted a total production of 123 kboed (kilo barrel of Oil Equivalent per day), marking a 200% jump as compared to 42 kboed in the previous corresponding period. Notably, there was a 44% drop in the cash cost of production to USD 10.6/boe in FY23, from USD 18.9/boe in FY22.
ENOG’s sales and other revenue rose by about 93% to USD 1,419 million in the reporting period, versus USD 737 million in FY22. Furthermore, the company’s adjusted EBITDAX saw an increase of approximately 119% to USD 925 million in FY23, as compared to USD 422 million in pcp.
The company paid a dividend of USD 0.30 per share for the third quarter of the year in December 2023. It clocked an annual dividend yield of ENOG to around 9.18%.
For the fiscal year 2024, Energean expects production to be in the range of 155 kboed and 175 kboed. Its development and production expense for FY24 is likely to be between USD 400 million and USD 500 million.
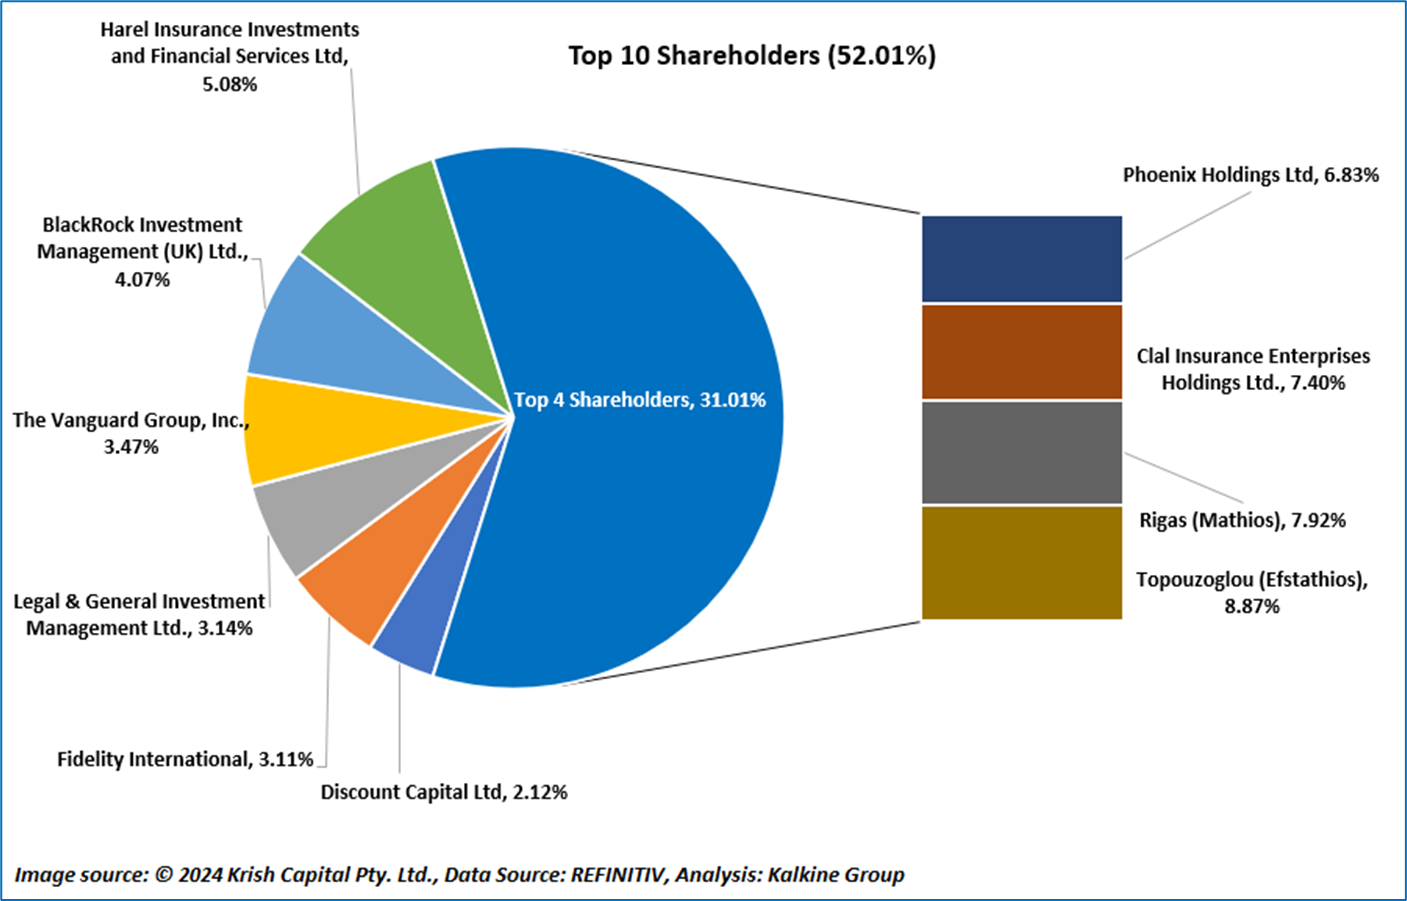
Top 10 Shareholders:
Around 52.01% of the total shareholdings is held by its top ten shareholders. While Topouzoglou (Efstathios) is the biggest shareholder with 8.87% shareholding, Rigas (Mathios) is the secondbiggest shareholder with 7.92% shareholding.
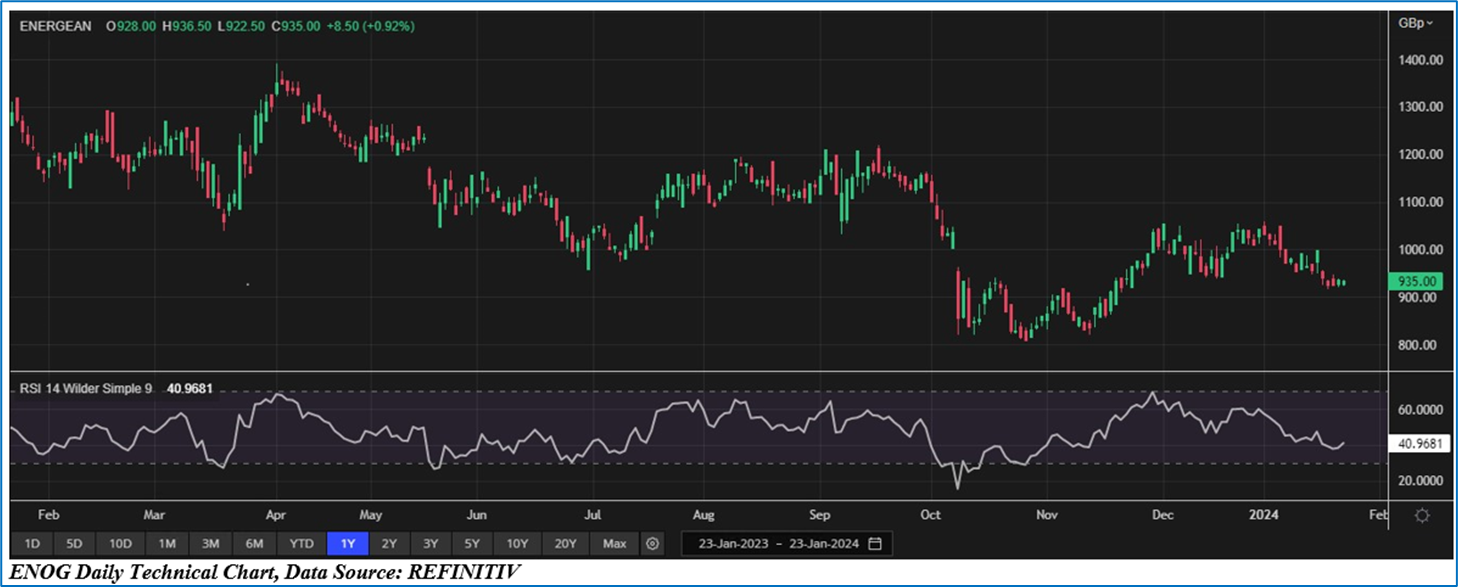
Stock Price Performance and Technical Summary:
ENOG’s stock price has gained approximately 12.65% in the last three months. It has fallen by around 17.62% over the last six months. The stock’s 52-week low and high price stand at GBX 807.50 and GBX 1,394.00, respectively.
Note 1: Past performance is not a reliable indicator of future performance.
Note 2: The reference data for all price data, currency, technical indicators, support, and resistance levels is 23 January 2024. The reference data in this report has been partly sourced from EODHD/Others.


 Please wait processing your request...