
Image source: © Vivilweb | Megapixl.com
Highlights
- Energean witnessed a massive jump in the total production from 35.2 kboed in 9M FY22 to 118.5 kboed in 9M FY23.
- In 9M FY23, the sales and other revenue of the company rose by approximately 85% to USD 1,016.3 million.
- For Q3 2023, ENOG has announced to pay a dividend of USD 0.30 per share to the shareholders later this month.
FTSE 250 listed hydrocarbon exploration and production entity, Energean PLC (LSE: ENOG) has its operations based across eight countries in the Mediterranean and the United Kingdom North Sea. ENOG is engaged in exploration and investments in novel solutions for production and development of energy with a low carbon footprint. It has its prime focus centred on natural gas.
ENOG witnessed a massive jump in the total production from 35.2 kboed (kilo barrel of oil equivalent per day) in 9M FY22 to 118.5 kboed in 9M FY23. Notably, the cash cost of production for the reporting period dropped by 41% to USD 11.2/ boe, as compared to USD 18.9/ boe in the previous corresponding period.
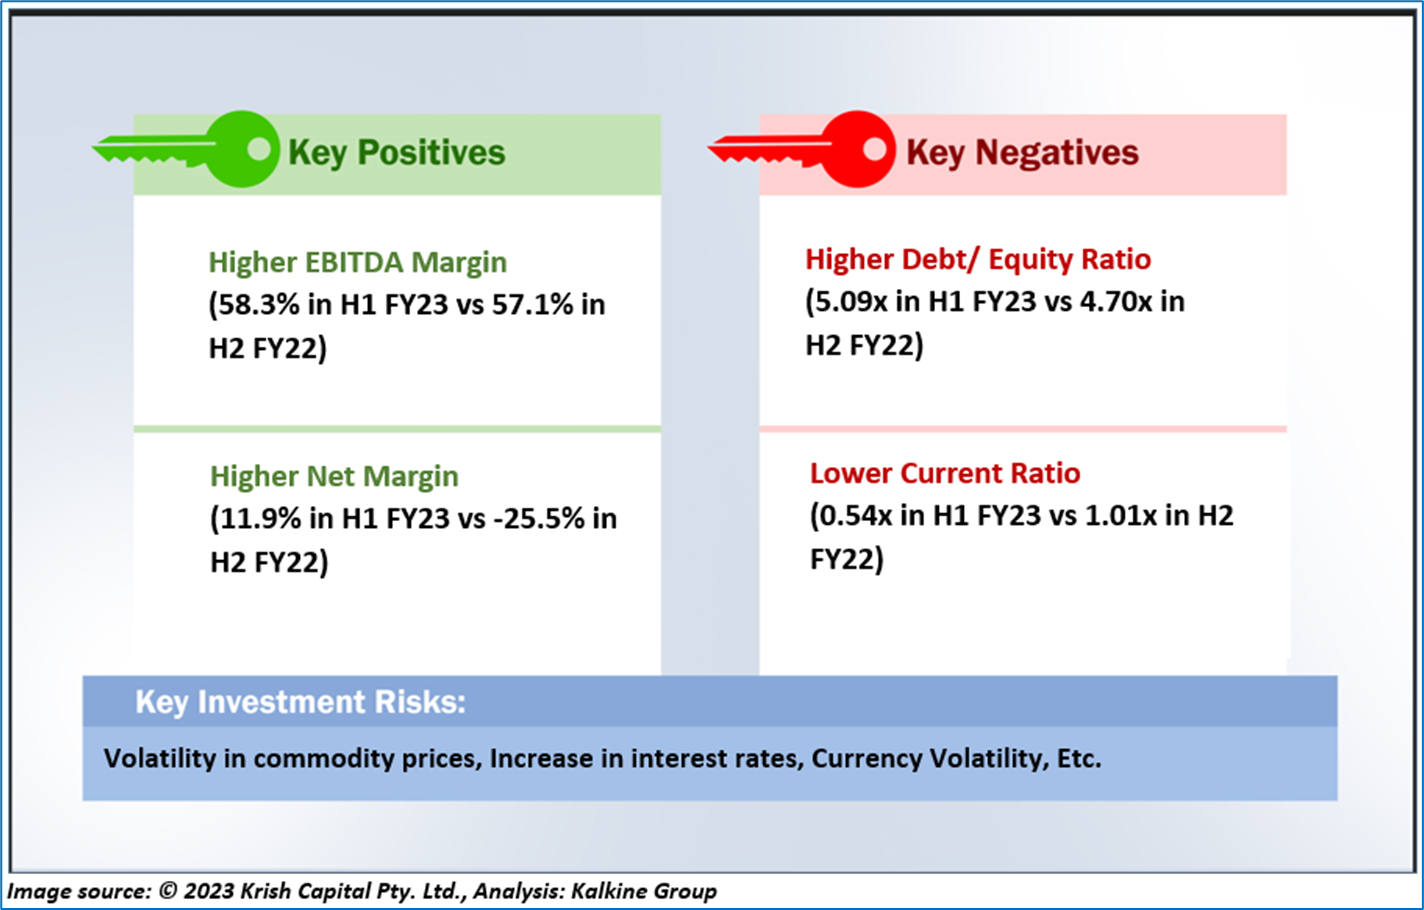
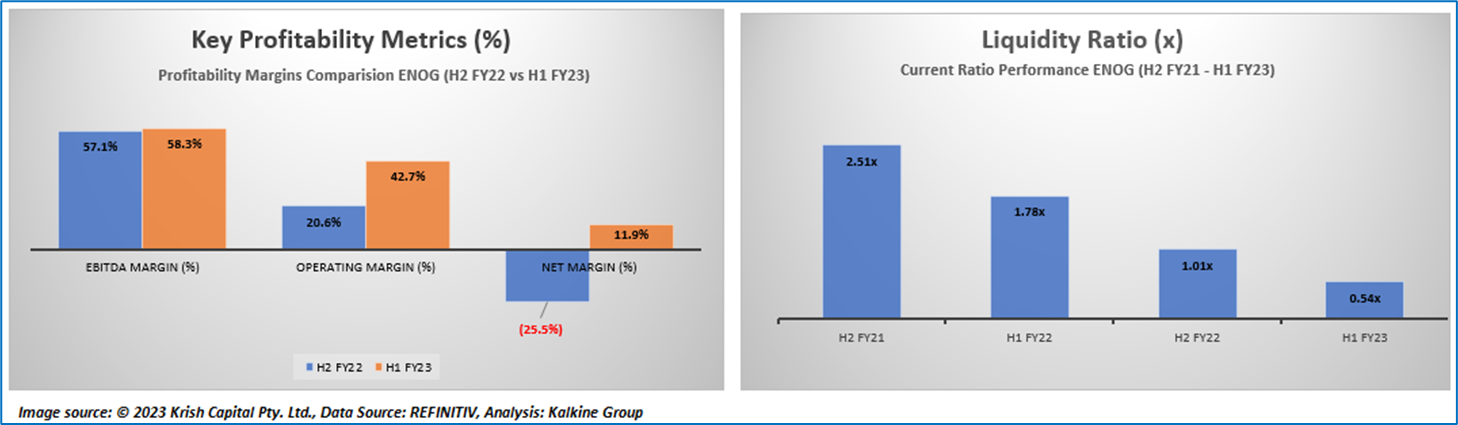
In 9M FY23, sales and other revenue of the company rose by approximately 85% to USD 1,016.3 million, versus USD 550.2 million in 9M FY22. Furthermore, Energean’s adjusted EBITDAX increased by 79% to USD 623.2 million in 9M FY23, against the EBITDAX of USD 348.5 million in pcp.
For the third quarter of the fiscal year 2023, the company has announced to pay a dividend of USD 0.30 per share to the shareholders later this month. This brings the annual dividend yield of ENOG to nearly 9.83% based on the closing market of 19 December 2023.
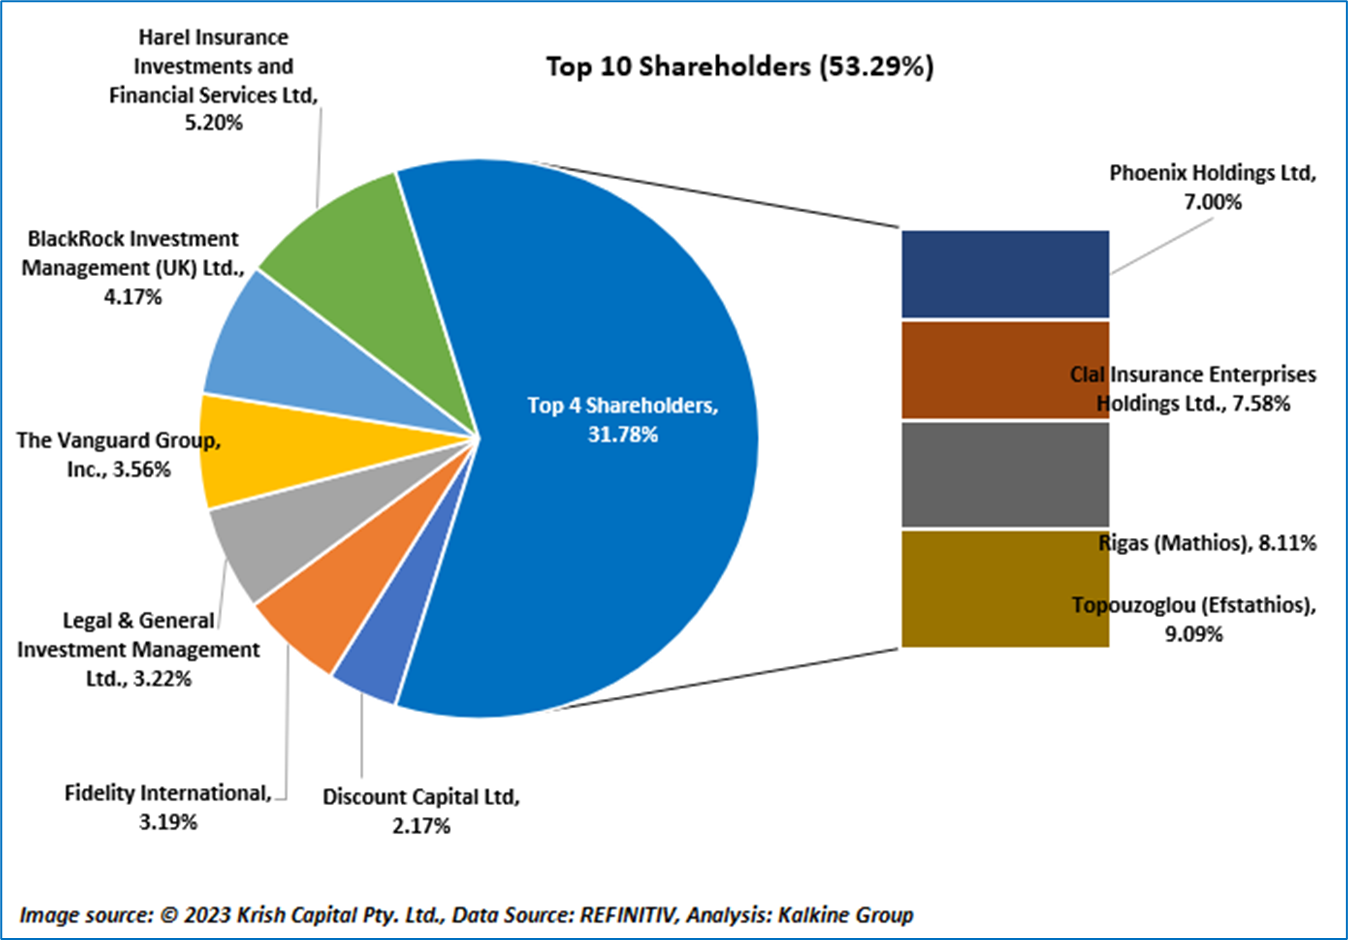
Top 10 Shareholders:
Around 53.29% of the total shareholdings is held by its top ten shareholders. While Topouzoglou (Efstathios) is the biggest shareholder with maximum number of stake of approximately 9.09%, Rigas (Mathios) is the second-biggest shareholder in the firm with over 8% shareholding.
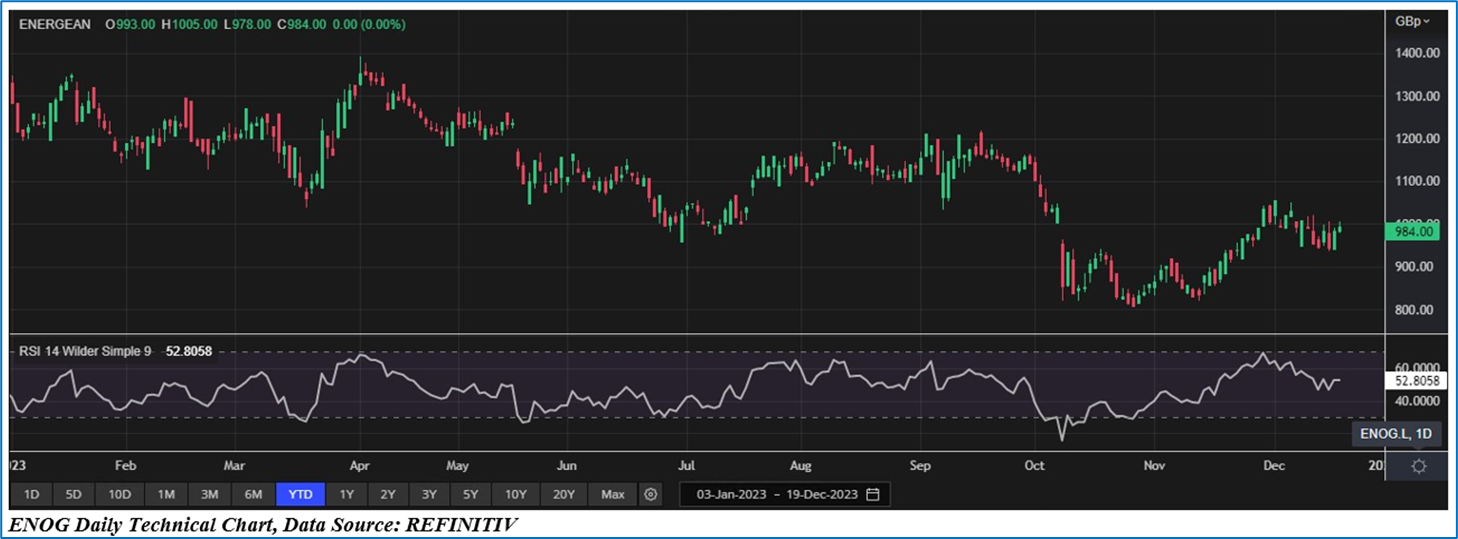
Stock Price Performance
ENOG’s stock price has fallen by almost 15.75% in the last three months. It has dropped by around 10.13% over the last six months. The stock’s 52-week low and high price stand at GBX 807.50 and GBX 1,394.00, respectively.
Note 1: Past performance is not a reliable indicator of future performance.
Note 2: The reference data for all price data, currency, technical indicators, support, and resistance levels is 19 December 2023. The reference data in this report has been partly sourced from EODHD/Others.


 Please wait processing your request...