_10_01_2025_09_55_38_258963.jpg)
Image source: © 2025 Krish Capital Pty.Ltd
Highlights
- Revenue fell 10.3% to GBP 72.35mn on the timing of astragon releases.
- Operating profit rose 10.4% to GBP 13.41mn, aided by cost control.
- Outlook: earnings expected slightly above forecasts with stronger H2 release schedule.
Everplay Group PLC (LSE:EVPL), part of the FTSE AIM UK 50 Index, is a global video game developer and publisher. The company operates through three main divisions: Team17, a prominent partner for indie developers known for IPs such as Hell Let Loose and Worms; astragon, a publisher of simulation and entertainment software; and Story Toys, a developer of educational apps and games for children.
EVPL’s revenue for H1FY25 was GBP 72.35 million, compared with GBP 80.64 million in H1 FY24, representing a decrease of 10.3%. Revenue decreased primarily because of a shift in the schedule for astragon's license revenues and new game releases. Operating profit for H1 FY25 was GBP 13.41 million, up from GBP 12.15 million in H1 FY24, a rise of 10.4%. Operating profit increased due to a reduction in administrative expenses and a rise in other income.
Profit for the period amounted to GBP 10.62 million, compared with GBP 9.01 million in H1 FY24, marking an increase of 17.9%. The period’s profit increase was driven by effective cost management and higher finance income.
Outlook
The company expects full-year earnings to be slightly above market expectations. This outlook is based on a more active second-half release schedule, including titles such as LEGO Bluey and new Nintendo Switch 2 products, alongside anticipated license deals and ongoing back-catalogue contributions. The sales mix is also expected to be favourable for margins.
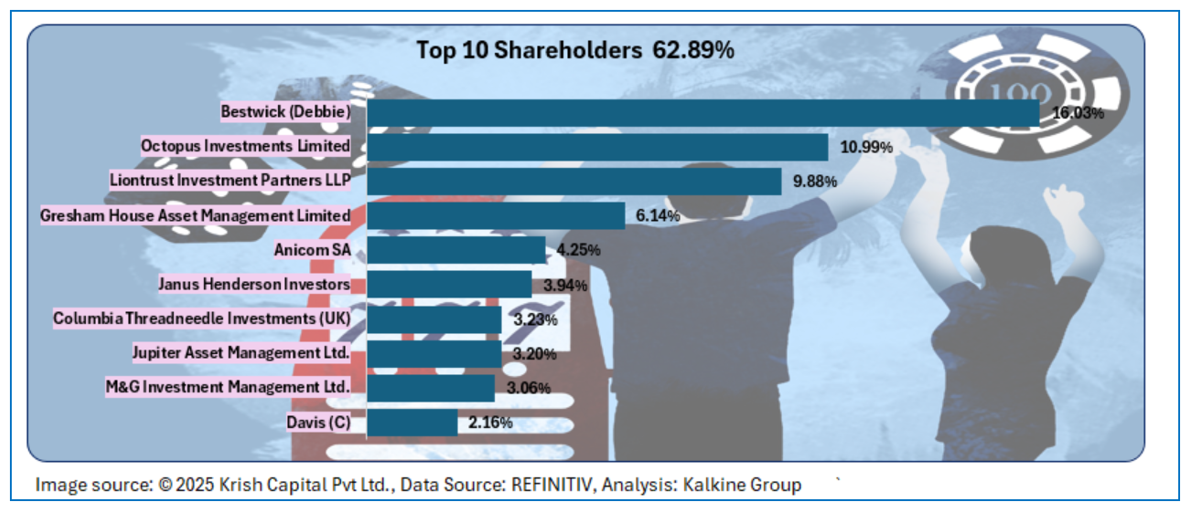
Top 10 Shareholders
The ten largest shareholders collectively account for approximately 62.89% of the company’s total shareholding. Among them, Debbie Bestwick and Octopus Investments Limited hold the largest stakes, at around 16.03% and 10.99%, respectively.
Stock Information
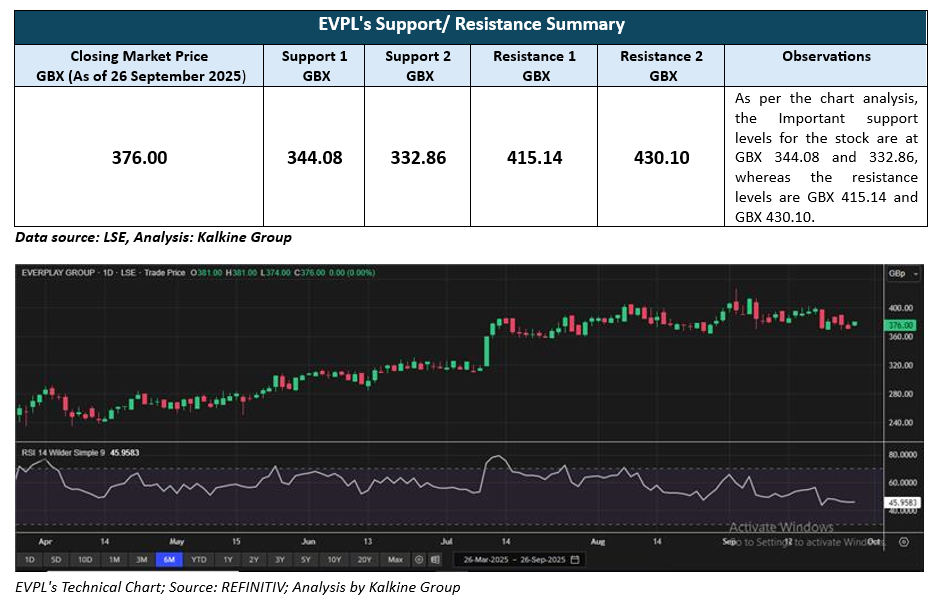
As of the closing price of 26 September 2025 (GBX 376), over the past three months, the stock has gained approximately 18.23%, and over the six-month period, 39.25%. The stock has a 52-week low of GBX 185.50 and a 52-week high of GBX 426.00 and is currently trading below the average of this range.
Note 1: Past performance is not a reliable indicator of future performance.
Note 2: The reference data for all price data, currency, technical indicators, support, and resistance levels Is 26 September 2025. The reference data in this report has been partly sourced from EODHD/Others.
Technical Indicators Defined
Support: A level at which the stock prices tend to find support if they are falling, and a downtrend may take a pause backed by demand or buying interest. Support 1 refers to the nearby support level for the stock and if the price breaches the level, then Support 2 may act as the crucial support level for the stock.
Resistance: A level at which the stock prices tend to find resistance when they are rising, and an uptrend may take a pause due to profit booking or selling interest. Resistance 1 refers to the nearby resistance level for the stock and if the price surpasses the level, then Resistance 2 may act as the crucial resistance level for the stock.


 Please wait processing your request...