
Highlights
- Filtronic’s finance income more than doubled in FY25, rising 121.7% year on year.
- Operating profit surged 272.2% YoY as revenue expanded faster than operating costs.
- Yearly profit climbed 351.6% YoY in FY25, supported by a higher-margin sales mix.
Filtronic PLC (LSE:FTC), a member of the FTSE AIM 100 index, specialises in designing and producing radio-frequency (RF), microwave, and millimetre-wave (mmWave) technologies.
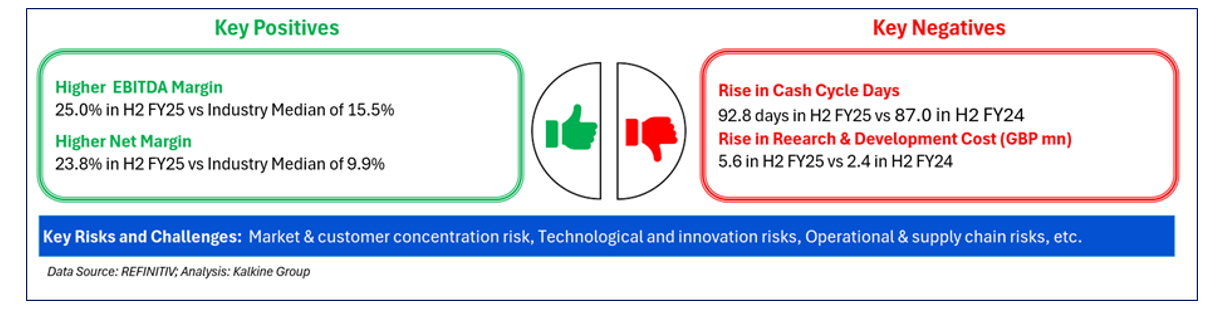
Filtronic reported year-on-year gains across key financial metrics for the financial year 2025 (FY25). Finance income rose to GBP 56.30 million from GBP 25.40 million in FY24, reflecting a 121.7% YoY increase driven by demand from a major strategic partner and effective operational execution. Operating profit climbed to GBP 13.40 million, up from GBP 3.60 million, marking a 272.2% YoY surge as revenue growth outpaced the company’s scaled cost base. Profit for the year rose to GBP 14.0 million compared to GBP 3.1 million in the prior year, a 351.6% YoY increase supported by revenue momentum and a higher-margin sales mix.
Company Outlook
Filtronic enters FY2026 with a healthy cash position, commercial momentum, and order book. As per the company, structural growth in its key markets and an expanding pipeline position it to meet market expectations for the year.
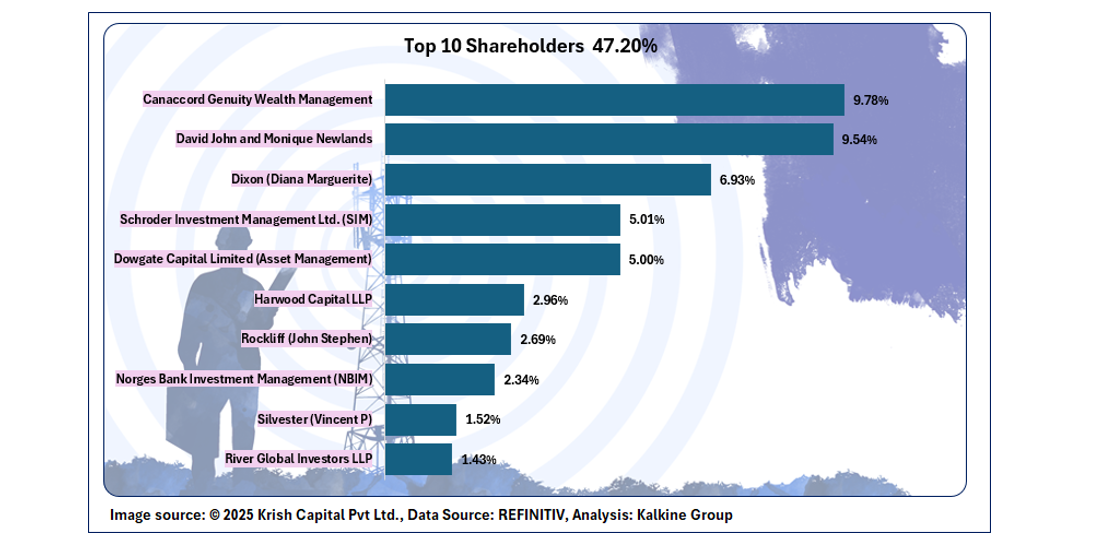
Top 10 Shareholders
The top ten shareholders collectively account for around 47.20% of the company’s total share base. Canaccord Genuity Wealth Management and David John and Monique Newlands hold the largest individual stakes at approximately 9.78% and 9.54%, respectively.
Stock Information
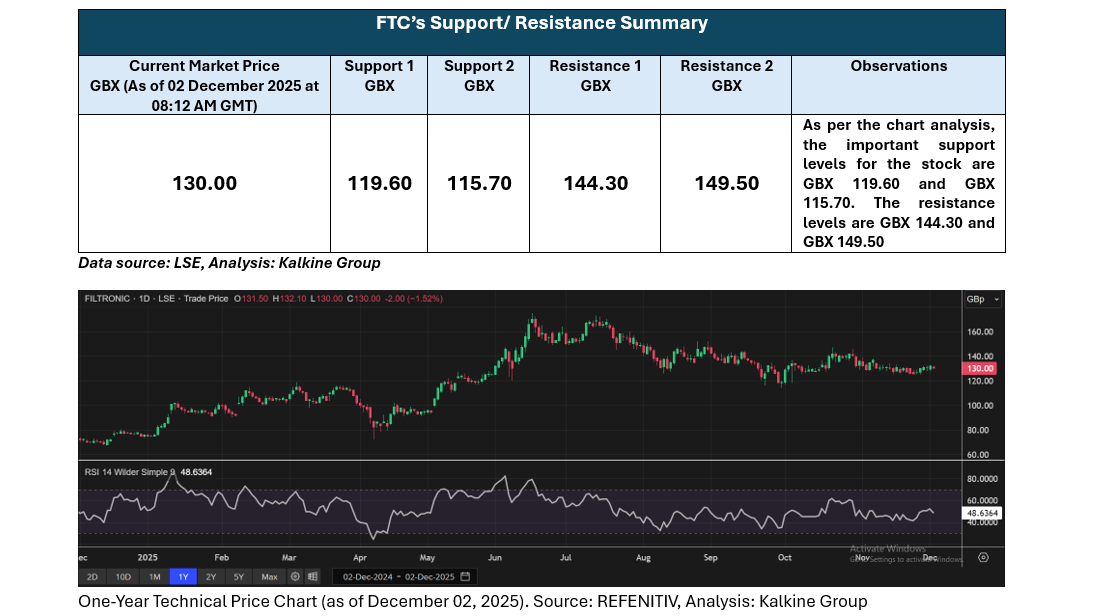
Filtronic’s stock gained 2.53% over the past week, though it declined 12.10% across the last three months. As of 2 December, the shares were trading at 132.10 GBX, up 76.72% year to date. The stock is currently trading above the midpoint of its 52-week range, positioned between the high of GBX 175.00 and the low of GBX 67.50.
Note 1: Past performance is not a reliable indicator of future performance.
Note 2: The reference data for all price data, currency, technical indicators, support, and resistance levels is 02 December 2025. The reference data in this report has been partly sourced from EODHD/Others.
Technical Indicators Defined
Support: A level at which the stock prices tend to find support if they are falling, and a downtrend may take a pause backed by demand or buying interest. Support 1 refers to the nearby support level for the stock and if the price breaches the level, then Support 2 may act as the crucial support level for the stock.
Resistance: A level at which the stock prices tend to find resistance when they are rising, and an uptrend may take a pause due to profit booking or selling interest. Resistance 1 refers to the nearby resistance level for the stock and if the price surpasses the level, then Resistance 2 may act as the crucial resistance level for the stock.


 Please wait processing your request...