
Highlights
- FRP Advisory’s H1 FY2026 revenue climbed 12.2% year-on-year to GBP 87.10 million.
- Operating profit edged up 1.6% to GBP 18.60 million in H1 FY2026.
- Profit for H1 FY2026 rose 3.1% to GBP 13.50 million, driven by revenue expansion and effective cost control.
- Cash conversion cycle improved to 181.6 days in H1 FY2026, highlighting favourable working capital management.
- Management remains confident of meeting FY2026 expectations, backed by positive H1 momentum and a healthy client pipeline.
FRP Advisory Group PLC (LSE:FRP) is a UK-based advisory firm listed on the FTSE AIM 100 Index, offering a broad range of specialist financial and business advisory services. The company operates across several core divisions, including restructuring advisory, corporate finance, forensic services, debt advisory, and pensions advisory. Its restructuring practice spans corporate financial advisory, formal insolvency appointments, personal insolvency solutions, and general business guidance
Financial Performance
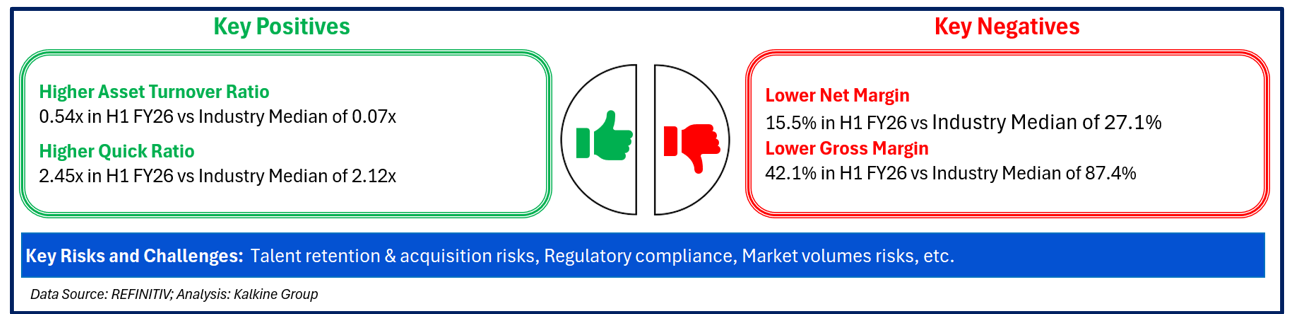
In H1 FY2026, the company reported revenue of GBP 87.10 million, representing a 12.2% year-on-year increase compared to GBP 77.60 million in H1 FY2025. The growth was primarily driven by organic expansion, contributions from strategic acquisitions, and favourable demand across its core service lines.
Operating profit in H1 FY2026 rose to GBP 18.60 million, up 1.6% from GBP 18.30 million recorded in H1 FY2025. The improvement reflected higher revenue alongside disciplined cost control measures, which supported enhanced operational efficiency during the period.
Profit for the year in H1 FY2026 increased by 3.1% to GBP 13.50 million, compared with GBP 13.10 million in H1 FY2025. The rise in bottom-line performance was underpinned by revenue growth, effective cost management, and the positive impact of acquisitions.
From a balance sheet and efficiency perspective, the cash conversion cycle improved to 181.6 days in H1 FY2026, compared to 184.8 days in H1 FY2025 and 184.1 days in H1 FY2024, indicating more efficient working capital management year-on-year. Meanwhile, the debt-to-equity ratio declined to 0.14x in H1 FY2026 from 0.20x in H1 FY2025 and 0.15x in H1 FY2024, reflecting a more conservatively leveraged capital structure and strengthening financial position.
Company Outlook
Management indicated that trading momentum in H1 FY2026 remained positive, with revenue, EBITDA, and net cash all showing improvement during the period. The Group stated that it is well positioned to deliver growth across its service divisions beyond the Budget, supported by a healthy pipeline of client activity.
Given the encouraging level of engagement and the assumption of sustained business activity, the Board has expressed confidence in meeting full-year market expectations for FY2026.
Top 10 Shareholders
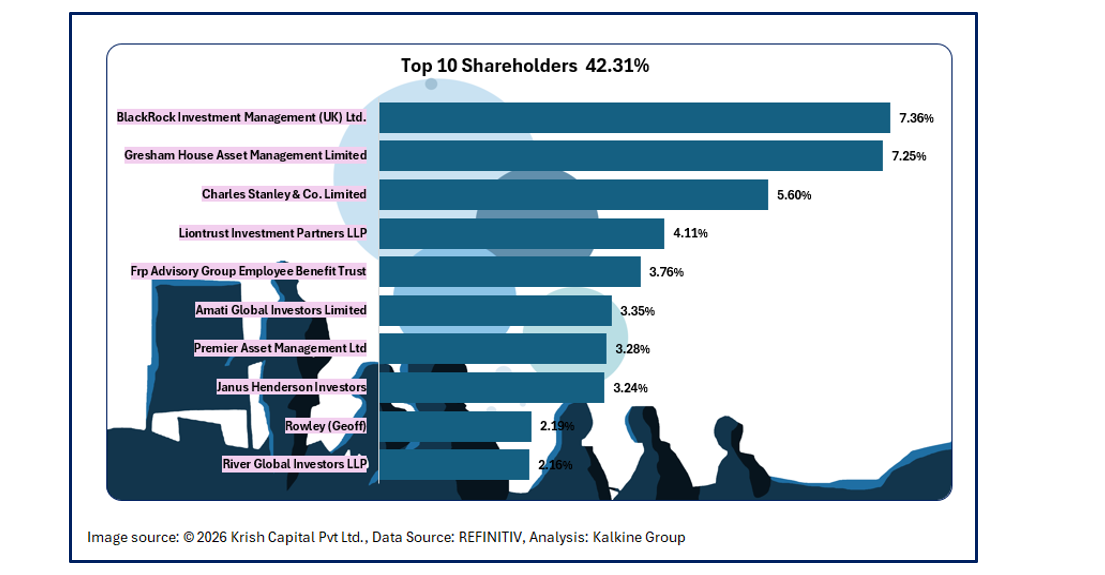
The top 10 shareholders collectively own about ~42.31% of the company's total shares. BlackRock Investment Management (UK) Ltd. and Gresham House Asset Management Limited hold a maximum stake in the company at ~7.36% and ~7.25%, respectively.
Stock Information
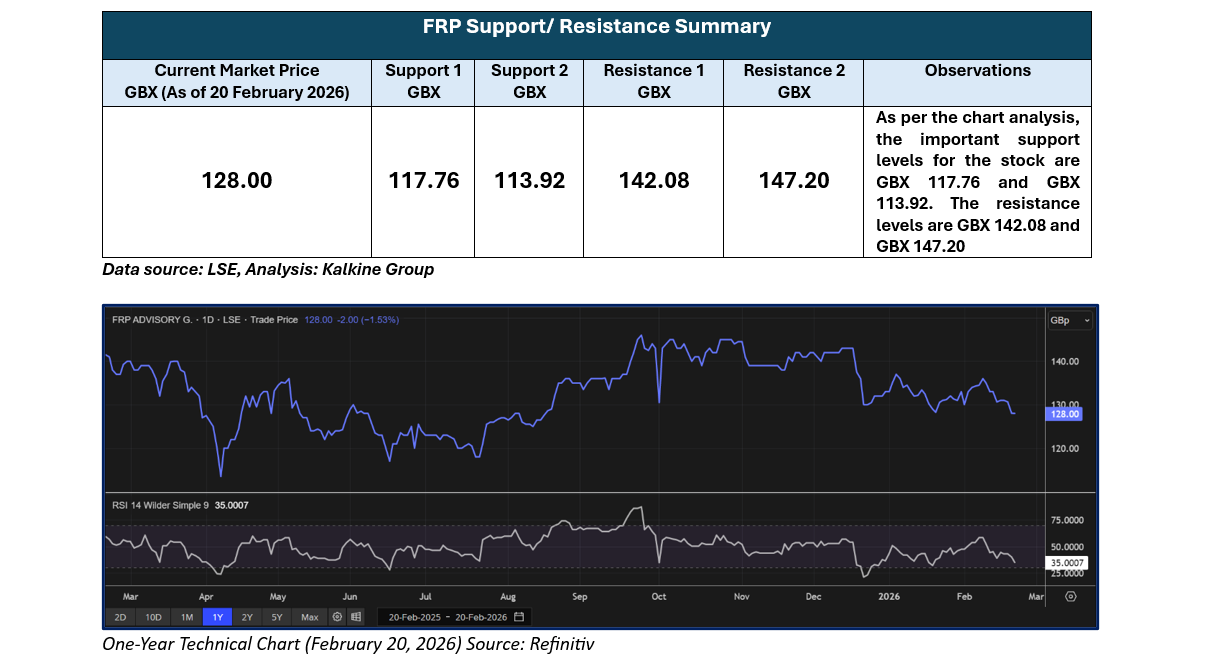
FRP has declined by ~1.68% over the last week , while declining approximately ~3,67% over the last six months. The stock has a 52-week high and 52-week low of GBX 151.00 and GBX 113.50 respectively and is currently trading below the average of 52-week high-low level.
Note 1: Past performance is not a reliable indicator of future performance.
Note 2: The reference data for all price data, currency, technical indicators, support, and resistance levels is 20 February 2026. The reference data in this report has been partly sourced from EODHD/Others.
Technical Indicators Defined
Support: A level at which the stock prices tend to find support if they are falling, and a downtrend may take a pause backed by demand or buying interest. Support 1 refers to the nearby support level for the stock and if the price breaches the level, then Support 2 may act as the crucial support level for the stock.
Resistance: A level at which the stock prices tend to find resistance when they are rising, and an uptrend may take a pause due to profit booking or selling interest. Resistance 1 refers to the nearby resistance level for the stock and if the price surpasses the level, then Resistance 2 may act as the crucial resistance level for the stock.


 Please wait processing your request...