
The FTSE 100’s dark horse has become its star thoroughbred. After a staggering run that saw shares more than triple since early 2024, we break down if the "Blue Eagle" still has wings or if the rally is flying into a ceiling.
The Big Rerate: How Barclays Left the Pack Behind
Two years ago, Barclays (LSE: BARC) was the "value trap" of the banking sector, trading at dismal five times forward earnings. Fast forward to January 2026, and the narrative has shifted from survival to supremacy.
The stock has surged over 240% since January 2024, hitting prices near 485p. While rivals like Lloyds and NatWest have enjoyed the "higher-for-longer" interest rate environment, Barclays outperformed by dodging the worst of the UK motor finance scandal and leveraging its massive structural hedge—a financial shield that effectively "locked in" higher yields even as central banks began cautious cuts.
Key Fundamentals: Is the "Cheap" Tag Gone?
Despite the meteoric rise, the valuation metrics suggest the stock isn't necessarily in "bubble" territory, though the era of the "giveaway" price is over.
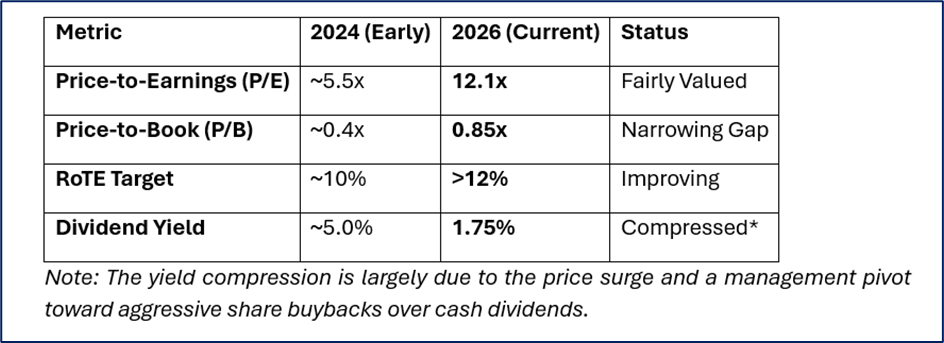
Source: Kalkine Group
The 2026 Catalyst: More Than Just Interest Rates
Investors asking "is there more to come?" should look at three specific tailwinds:
- The £10 Billion Giveaway: Barclays is in the final stretch of its 2024–2026 plan to return £10 billion to shareholders. On January 8, 2026, the bank executed another massive buyback of 60 million shares, constantly shrinking the share count and boosting Earnings Per Share (EPS).
- The Investment Bank Rebound: After years of being a "drag," the Investment Banking arm is finding its footing. With global M&A activity and IPO markets thawing in early 2026, Barclays is positioned to capture fees that its more domestic UK rivals (Lloyds/NatWest) simply cannot reach.
- Efficiency Savings: The bank hit its £500 million cost-cutting target a full quarter early. A leaner Barclays means higher margins even if the Bank of England accelerates rate cuts.
Analyst View: "Barclays is no longer a 'recovery' story; it's an execution story. While a second tripling of the share price is mathematically unlikely in the near term, the path to 525p remains open if the Investment Bank captures the 2026 M&A wave." — RBC Capital Markets (Recent Upgrade)
The "Bear Case": What Could Stop the Party?
No rally is risk-free. The market is currently weighing two major headwinds:
- The US Consumer Trap: Barclays has significant exposure to the US credit card market. With US unemployment ticking up to 4.6% in late 2025, delinquency rates are the "canary in the coal mine" for the 2026 profit outlook.
- The "Peak Margin" Fear: As the BoE and Fed continue their descent from peak rates, the net interest margin (NIM) will naturally tighten. The bank's structural hedge provides a cushion, but not a permanent immunity.
The Scorecard: Latest Analyst Ratings (Q1 2026)
The consensus remains a "Moderate Buy," but with a significant catch: the average price target of 445.83p is now actually below the current trading price of ~485p, suggesting many analysts believe the stock has "run ahead of its skis."
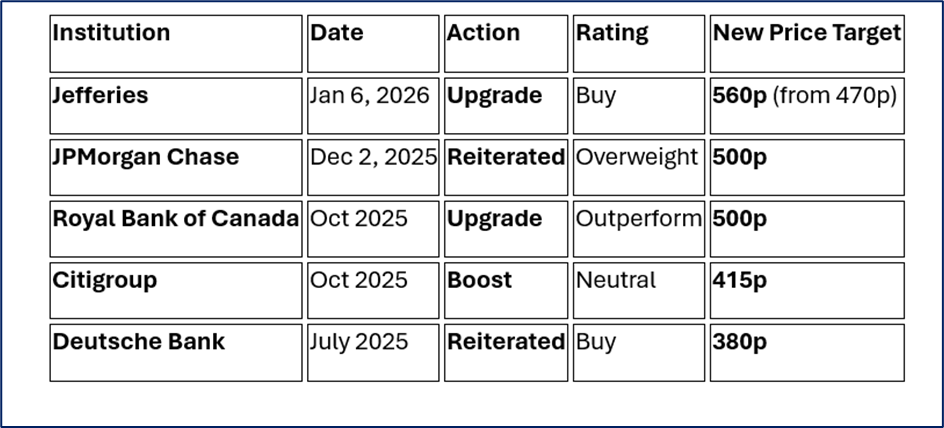
Source: Market Data
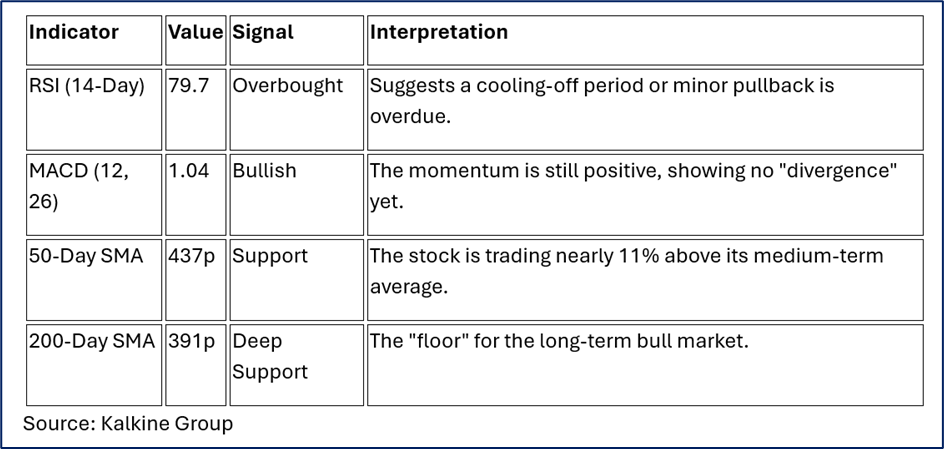
The Trader’s View: Is the Chart Screaming "Overbought"?
While the fundamental story focuses on buybacks and interest margins, the technical chart is currently flashing signals that have short-term traders on high alert. After a multi-year vertical climb, Barclays is testing "uncharted" territory for this decade.
Current Price Action: The "Blue Eagle" at the Ceiling
As of January 9, 2026, Barclays (BARC) is trading near 485p, flirting with its 52-week high of 492.95p. The stock is firmly positioned above its major moving averages, a classic sign of a strong bull trend, but one that is looking increasingly "extended."
Support & Resistance: The Battle Lines for Q1 2026
Technical analysts are watching a few "psychological" and "mathematical" levels that could dictate the next move:
- Resistance 1 (The Wall): 492p – 500p. This is the immediate hurdle. A clean break above 500p would be a massive psychological victory, potentially triggering "FOMO" buying toward 525p.
- Support 1 (The Safety Net): 473p. If the overbought RSI triggers a sell-off, this is the first area where buyers are expected to step back in.
- Support 2 (The Structural Floor): 430p. A drop to this level would represent a healthy consolidation, retesting the 50-day moving average without breaking the long-term uptrend.
The "Golden Star" vs. Overextension
Some technical models, like the Golden Star (a refined version of the Golden Cross), remain bullish on Barclays due to the sheer strength of the upward momentum and the volume accompanying recent buybacks.
However, "gap" analysis suggests the stock has moved too far, too fast. Historically, when the RSI hits the 80 level, the stock often enters a "sideways" period to allow the moving averages to catch up.
Technical Opinion: "The trend is undeniably your friend here, but the 'friend' is currently sprinting. Most chartists would look for a period of consolidation between 460p and 480p to reset the indicators before the next assault on the 500p barrier."
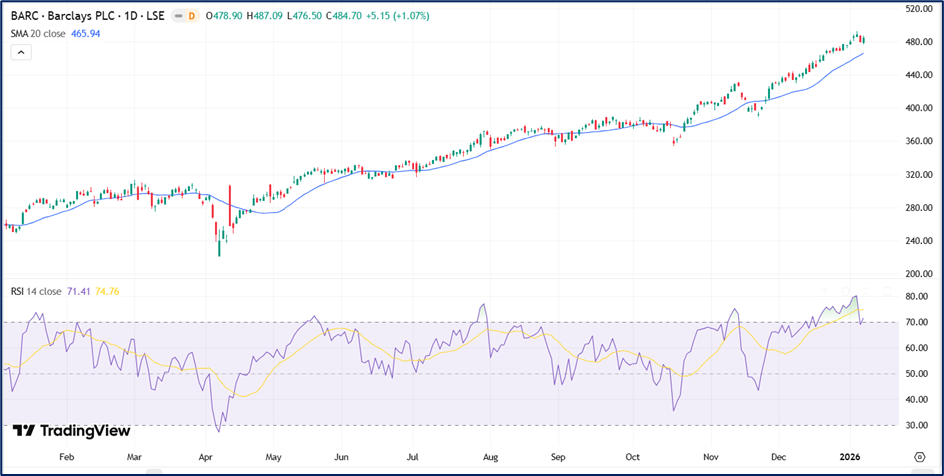
Source: Trading View
Market Analysts Verdict: Buy, Hold, or Fold?
For those who bought at 145p, taking some profit is the "Foolish" (and wise) move. However, for new money, Barclays remains a solid "Outperform" for long-term portfolios. It still trades below its Tangible Net Asset Value (TNAV) of 392p, suggesting that even after a 200%+ run, you aren't yet paying full price for the underlying assets. The "sensational" gains may be in the rearview mirror, but with a 12% projected upside and a relentless buyback program, the Blue Eagle still has room to soar.


 Please wait processing your request...