
Highlights
- Goldplat reported H1FY25 revenue of GBP 29.5 million, down 21.1% year-on-year.
- Profit for the period increased to GBP 1.4 million, reflecting a 27.3% YoY rise.
- Gross margin and EBITDA margin remained below industry medians in H1FY24.
- Outlook includes expansion in West Africa, Brazil development, and cost optimisation initiatives.
Goldplat PLC (LSE:GDP) is a United Kingdom–based gold recovery services company listed on the FTSE AIM All-Share Index. The company operates in South Africa and Ghana, producing gold and other precious metals by processing by-products from the mining industry.
Goldplat’s revenue for the half year ended 31 December 2024 (H1FY25) came in at GBP 29.5 million, down from GBP 72.6 million in the prior corresponding period, representing a 21.1% year-on-year decline. Gross profit edged slightly lower to GBP 4.3 million from GBP 4.4 million, a YoY fall of 2.3%.
Despite the softer top line, profit for the period rose to GBP 1.4 million from GBP 1.1 million, marking a 27.3% YoY increase, with management attributing the improvement to rigorous cost control and enhanced operational efficiency that supported the bottom line.
Meanwhile, the company’s key positives include a higher current ratio of 1.7x in H1 FY24 compared with the industry median of 1.5x, and a higher asset turnover ratio of 0.6x in H1 FY24 versus the industry median of 0.4x.
Key negatives include a decline in gross margin to 14.7% in H1 FY24 compared with the industry median of 44.3%, and a lower EBITDA margin of 9.9% in H1 FY24 versus the industry median of 11.7%.
Company Outlook
The company's outlook notes that it is expanding its footprint by growing market share in West Africa, developing land in Brazil, and enhancing service delivery for lower-grade materials, with plans to increase its presence in South Africa and neighboring countries. It also highlights efforts to enhance operational efficiency by reducing CIL circuit costs and finalizing an agreement with DRDGOLD to reprocess TSF material via pipeline, which is important for asset optimisation and environmental stewardship.
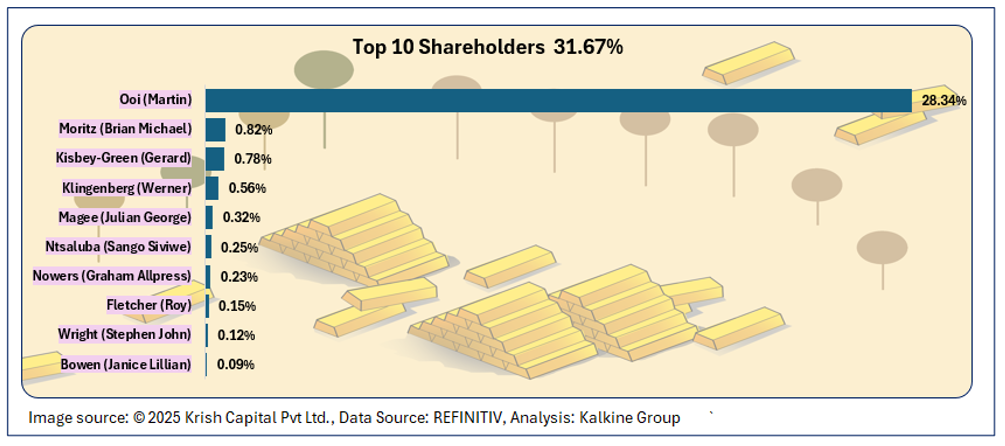
Top 10 Shareholders
The top ten shareholders collectively account for about 31.67% of the total shareholding. Ooi (Martin) and Moritz (Brian Michael) hold the largest individual stakes at roughly 28.34% and 0.82%, respectively.
Stock Information
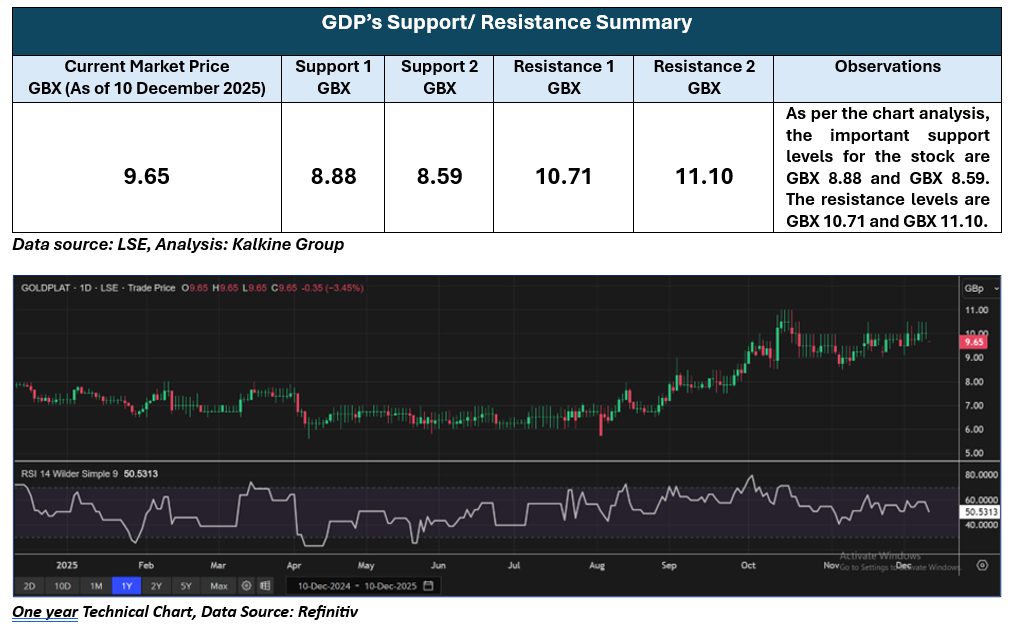
The stock has increased by approximately 11.11% over the past month and by around 29.00% over the past three months. It has a 52-week high of GBX 11.01 and a 52-week low of GBX 5.60, and is currently trading above the midpoint of this range.
 Note 1: Past performance is not a reliable indicator of future performance.
Note 2: The reference data for all price data, currency, technical indicators, support, and resistance levels is 10 December 2025. The reference data in this report has been partly sourced from EODHD/Others.
Technical Indicators Defined
Support: A level at which the stock prices tend to find support if they are falling, and a downtrend may take a pause backed by demand or buying interest. Support 1 refers to the nearby support level for the stock and if the price breaches the level, then Support 2 may act as the crucial support level for the stock.
Resistance: A level at which the stock prices tend to find resistance when they are rising, and an uptrend may take a pause due to profit booking or selling interest. Resistance 1 refers to the nearby resistance level for the stock and if the price surpasses the level, then Resistance 2 may act as the crucial resistance level for the stock.


 Please wait processing your request...