
Image source: © 2025 Krish Capital Pty.Ltd
Highlights
- Turnover rose 1.3% YoY to GBP 7,986 mn, led by Specialty Medicines and HIV.
- Core operating profit grew 4.7% YoY to GBP 2,631 mn, supported by Vaccines and royalties.
- Profit after tax surged 26.2% YoY to GBP 1,646 mn, driven by lower finance costs.
GSK PLC (LSE: GSK) is a London-headquartered multinational pharmaceutical and biotechnology company and a constituent of the FTSE 100 index.
For the second quarter of FY25, the company reported turnover of GBP 7,986 million, up 1.3% year-on-year, driven by performance in Specialty Medicines, Respiratory, Immunology & Inflammation, and HIV. During the same period, core operating profit rose 4.7% yoy to GBP 2,631 million, supported by higher sales in Specialty Medicines and Vaccines, increased royalty income, and strategic R&D investment in Oncology and Vaccines. Profit after taxation increased 26.2% to GBP 1,646 million, reflecting improved core business performance and lower finance costs.
Company Outlook
The 2025 guidance is based on stable conditions, assuming no significant supply disruptions, new litigation, M&A activity, or changes to the company’s HIV venture stake. It also reflects expectations of a consistent regulatory and trade environment, with all announced divestments already included.
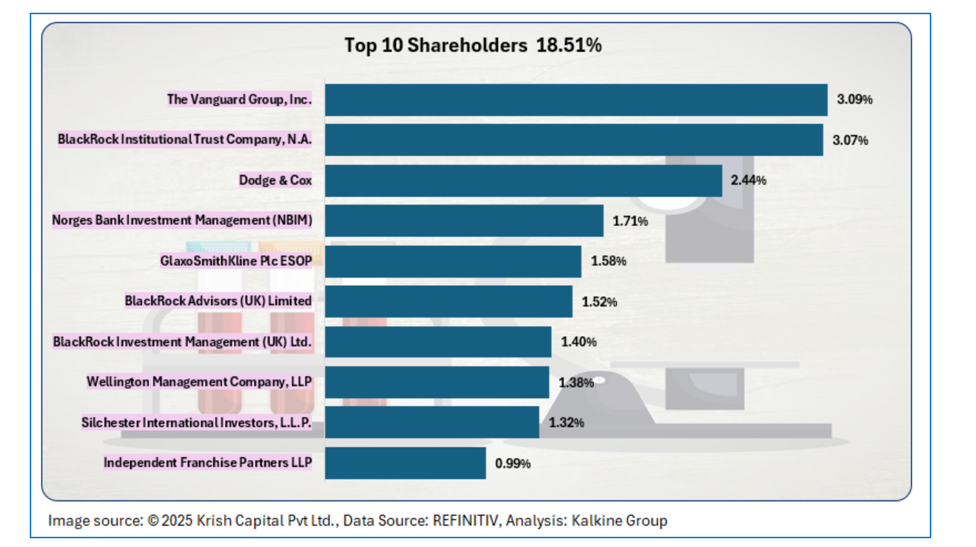
Top 10 Shareholders
The top ten shareholders of GSK collectively hold around 18.51% of the company’s shares. The Vanguard Group, Inc. and BlackRock Institutional Trust Company, N.A. are the largest shareholders, with stakes of approximately 3.09% and 3.07%, respectively.
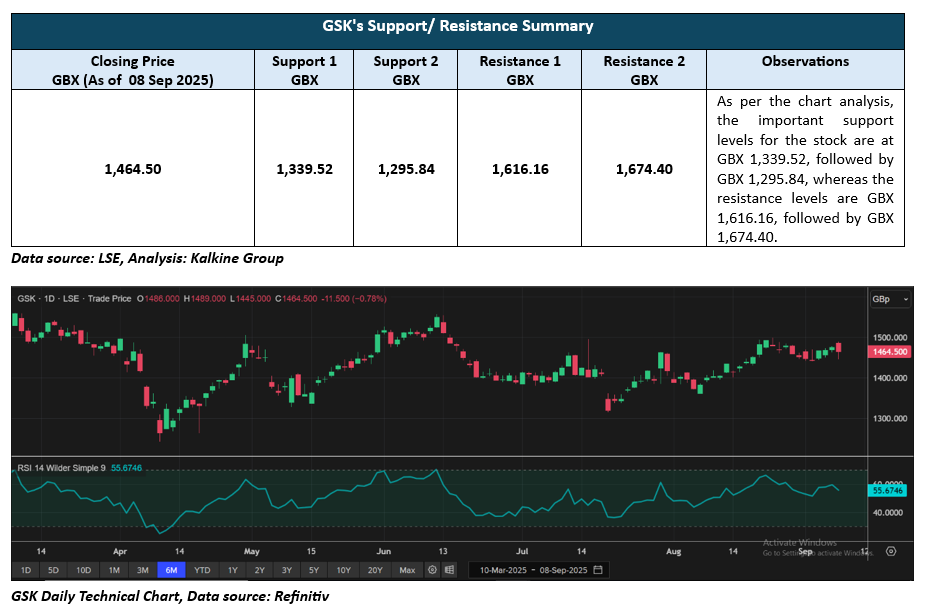
Stock Information
GSK closed at GBX 1,464.5 on 08 Sep 2025, marking a 0.79% intraday decline. Over the past week, the stock gained 1.17%, while its 1-month return stands at 2.49%. Year-to-date, GSK has delivered an 8.76% gain. The stock has traded between a 52-week high of GBX 1,678.68 and a 52-week low of GBX1,242.50.
Note 1: Past performance is not a reliable indicator of future performance.
Note 2: The reference data for all price data, currency, technical indicators, support, and resistance levels Is 08 September 2025. The reference data in this report has been partly sourced from EODHD/Others.
Technical Indicators Defined
Support: A level at which the stock prices tend to find support if they are falling, and a downtrend may take a pause backed by demand or buying interest. Support 1 refers to the nearby support level for the stock and if the price breaches the level, then Support 2 may act as the crucial support level for the stock.
Resistance: A level at which the stock prices tend to find resistance when they are rising, and an uptrend may take a pause due to profit booking or selling interest. Resistance 1 refers to the nearby resistance level for the stock and if the price surpasses the level, then Resistance 2 may act as the crucial resistance level for the stock.


 Please wait processing your request...