
Image source: Shutterstock
Highlights
- GMS reported FY24 revenue of USD 167.5 million, marking a 10.5% YoY increase
- Adjusted EBITDA rose 14.7% YoY to USD 100.4 million, supported by improved cost efficiency and revenue growth
- Net profit declined by 9.0% YoY to USD 38.3 million, mainly due to lower impairment reversal and higher tax charges
- The company maintained FY25 EBITDA guidance at USD 100–108 million and set a higher FY26 target of USD 105–115 million
Gulf Marine Services PLC (LSE:GMS) is a United Kingdom-based operator of self-propelled and self-elevating support vessels (SESVs).
In the financial year 2024 (FY24), GMS recorded a 10.5% increase in revenue, reaching USD 167.5 million compared to USD 151.6 million in the prior year. This growth was mainly supported by a 9% rise in average day rates to USD 33.1k, along with new charter agreements, improved pricing, and a high fleet utilisation rate of 92%. The company also saw an increase in its contract backlog, contributing to the overall improvement in revenue.
Adjusted EBITDA rose by 14.7% YoY to USD 100.4 million, reflecting both higher revenue and improved cost efficiency, as cost of sales as a percentage of revenue declined by 300 basis points to 51%.
Net profit for the year declined by 9.0% to USD 38.3 million, compared to USD 42.1 million in FY23. The reduction was mainly due to a lower impairment reversal of USD 9.2 million in FY24 versus USD 33.4 million in the previous year, as well as increased tax charges. These effects were partially offset by a 25% decrease in finance costs, which fell to USD 23.5 million.
On a positive note, the company outperformed the industry median with significantly higher margins in FY24, achieving a gross margin of 60% versus the industry median of 21.2%, and an EBITDA margin of 22.8% compared to 5.8%.
Company Outlook
The company has reaffirmed its adjusted EBITDA guidance for FY25 at USD 100–108 million and introduced a higher target range of USD 105–115 million for FY26, indicating measured confidence amid shifting economic conditions.
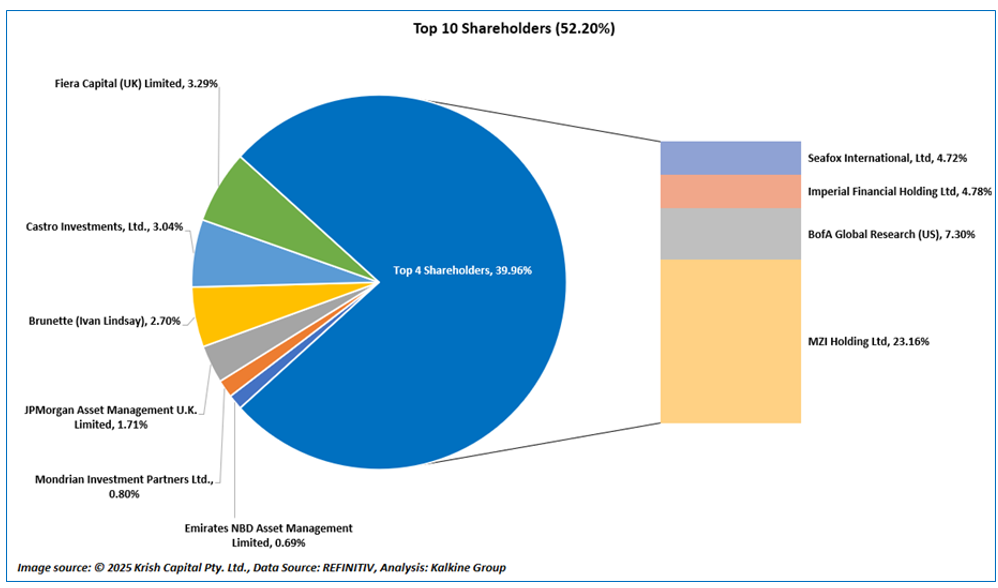
Top 10 Shareholders
The top 10 shareholders of GMS collectively account for approximately 52.2% of the total shareholding. MZI Holding Ltd is the largest shareholder with a stake of around 23.16%, followed by BofA Global Research (US), which holds about 7.30%, as illustrated in the chart below.
Stock Information
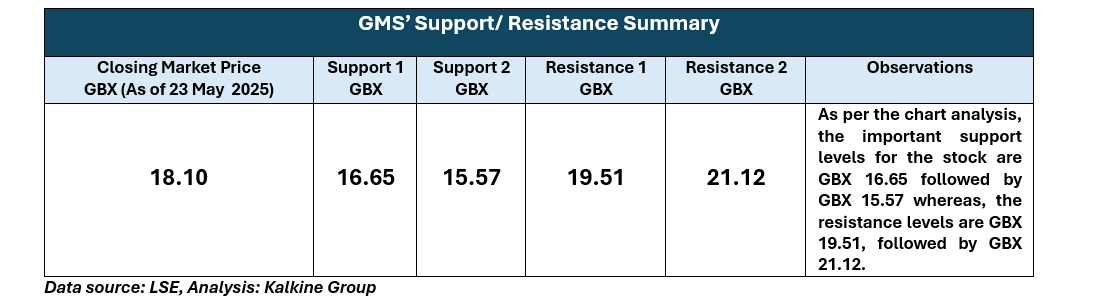
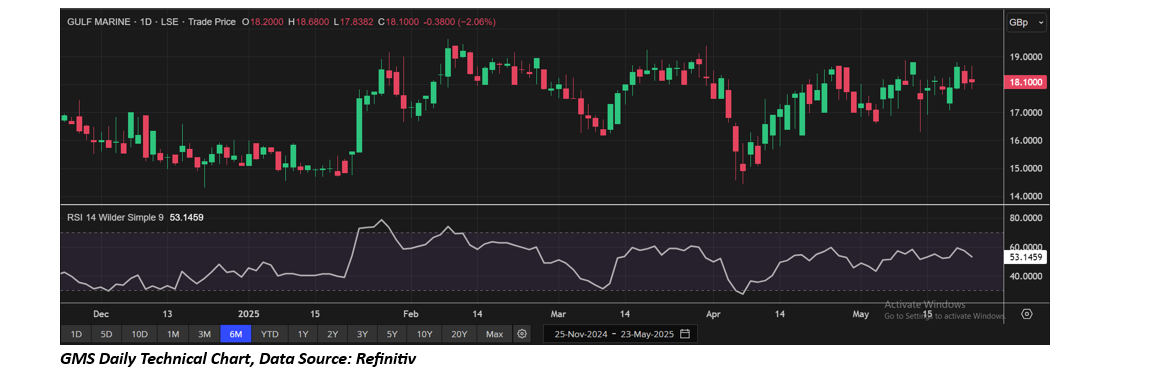
Over the past six months, the stock rose about 7.10%, trading between a 52-week low of GBX 14.15 and a high of GBX 21.00. As of 23 May 2025, it closed at GBX 18.10, placing it above the midpoint of its recent trading range.
Note 1: Past performance is not a reliable indicator of future performance.
Note 2: The reference data for all price data, currency, technical indicators, support, and resistance levels is 23 May 2025. The reference data in this report has been partly sourced from EODHD/Others.
Technical Indicators Defined
Support: A level at which the stock prices tend to find support if they are falling, and a downtrend may take a pause backed by demand or buying interest. Support 1 refers to the nearby support level for the stock and if the price breaches the level, then Support 2 may act as the crucial support level for the stock.
Resistance: A level at which the stock prices tend to find resistance when they are rising, and an uptrend may take a pause due to profit booking or selling interest. Resistance 1 refers to the nearby resistance level for the stock and if the price surpasses the level, then Resistance 2 may act as the crucial resistance level for the stock.


 Please wait processing your request...