
Highlights
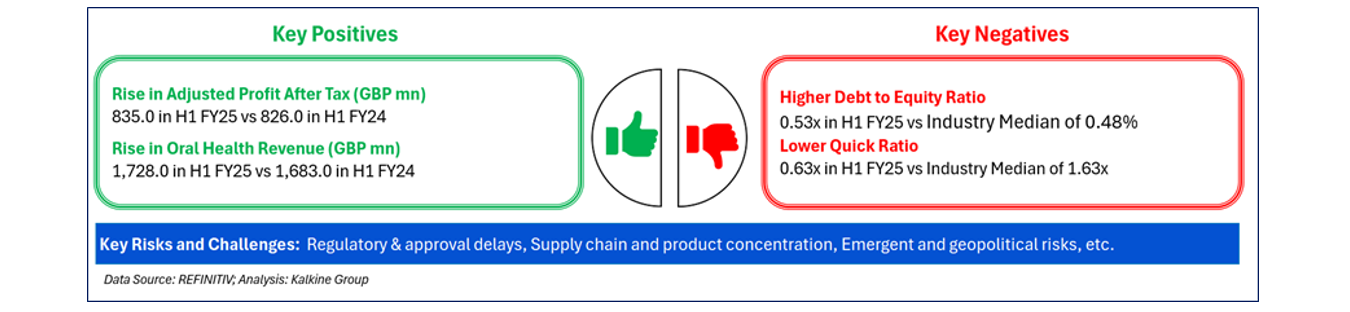
- Haleon’s H1FY25 revenue came in at GBP 5,480 mn, down 3.8% year-on-year due to FX headwinds and portfolio divestments
- Softer sales in the Respiratory Health segment contributed to the revenue decline during the period
- H1FY25 profit increased 7.8% YoY to GBP 813 mn, supported by lower finance costs
- The company expects FY25 organic revenue growth of around 3.5% with high single-digit operating profit growth, partly offset by M&A divestment impacts
Haleon PLC (LSE:HLN) ranks among the FTSE 100 and operates as a UK-based consumer healthcare firm. Its portfolio covers six key areas: oral health, vitamins, minerals and supplements (VMS), pain relief, respiratory health, digestive health, therapeutic skin health, and more.
For the first half of the financial year 2025 (H1FY25), the company reported revenue of GBP 5,480 mn, compared with GBP 5,694 mn in H1FY24, reflecting a year-on-year decline of 3.8%. The decrease was attributed to foreign exchange headwinds, portfolio divestments, and softer sales in the Respiratory Health segment.
Operating profit for H1 stood at GBP 1,203 mn, up from GBP 1,151mn in the corresponding prior period, representing a 4.5% year-on-year increase. The change was linked to higher R&D expenses and lower operational efficiency.
Profit reached GBP 813 mn in H1 FY25, compared with GBP 754 mn in H1 FY24, marking a 7.8% increase. The improvement in profit was driven by a reduction in finance costs.
Company Outlook
Haleon provided its FY25 outlook, indicating expectations of around 3.5% organic revenue growth and high single-digit organic operating profit growth for FY2025. The company noted that this outlook is partly offset by an estimated 2.0% revenue impact arising from net M&A divestments and associated costs.
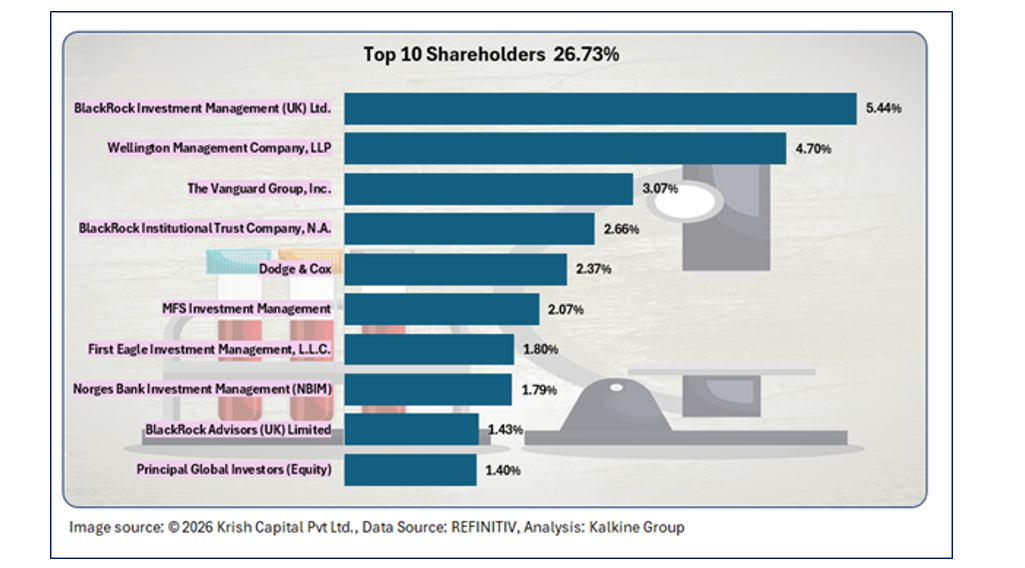
Top 10 Shareholders
The top 10 shareholders collectively own about 26.73% of the company's total shares. BlackRock Investment Management (UK) Ltd. and Wellington Management Company, LLP hold the largest stakes at approximately 5.44% and 4.70%, respectively.
Stock Information
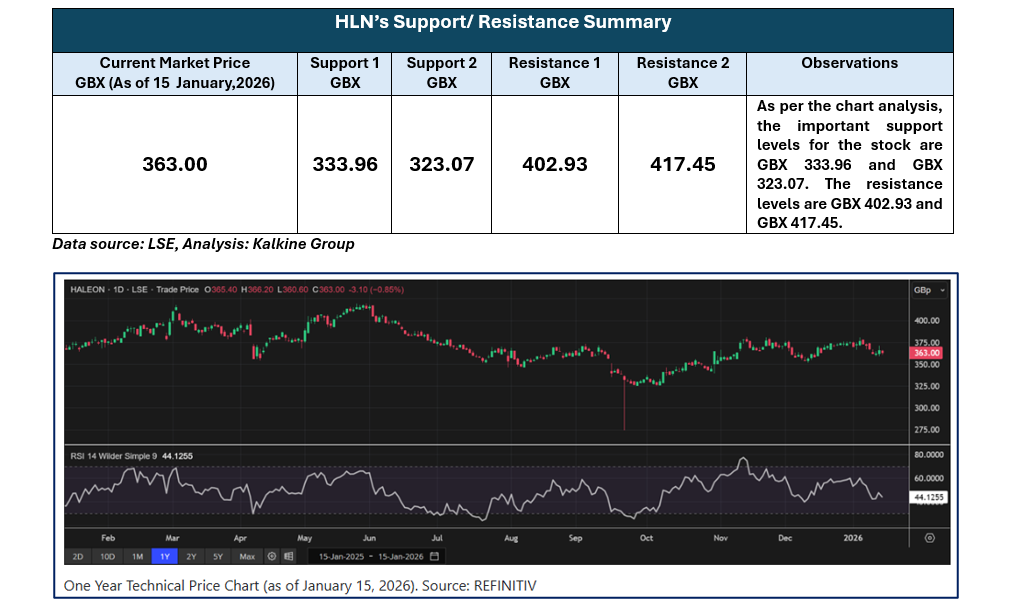
The stock declined 1.98% over the past week but recorded a 7.17% gain over the past three months. It is trading above the midpoint of its 52-week range, with a high of GBX 419.50 and a low of GBX 274.40.
Note 1: Past performance is not a reliable indicator of future performance.
Note 2: The reference data for all price data, currency, technical indicators, support, and resistance levels is 15 January 2026. The reference data in this report has been partly sourced from EODHD/Others.
Technical Indicators Defined
Support: A level at which the stock prices tend to find support if they are falling, and a downtrend may take a pause backed by demand or buying interest. Support 1 refers to the nearby support level for the stock and if the price breaches the level, then Support 2 may act as the crucial support level for the stock.
Resistance: A level at which the stock prices tend to find resistance when they are rising, and an uptrend may take a pause due to profit booking or selling interest. Resistance 1 refers to the nearby resistance level for the stock and if the price surpasses the level, then Resistance 2 may act as the crucial resistance level for the stock.


 Please wait processing your request...