Image source: Shutterstock
Highlights
- Hikma Pharmaceuticals’ H1 FY24 revenue reached USD 1,569 million, up 10% from H1 FY23
- Operating profit surged 43.3% to USD 351 million; cash flow decreased 10.8%
- Future revenue growth is expected at 6% to 8%, with a core operating profit of USD 700-730 million
Hikma Pharmaceuticals PLC (LSE: HIK) is a pharmaceutical company listed on the FTSE 100. It focuses on developing, manufacturing, and marketing generic, branded, and in-licensed products.
In H1 FY24, the company reported a revenue of USD 1,569 million, marking a 10% increase from USD 1,427 million in H1 FY23. This growth was driven by a 4% rise in injectables, particularly in North America, MENA, and Europe, alongside a 12% increase in branded revenue, fuelled by oncology and chronic care products.
Generics also saw a 15% uptick, supported by strong demand. Operating profit surged by 43.3% to USD 351 million, although cash flow from operating activities decreased by 10.8% to USD 198 million due to increased investments in working capital.
Recent Business Update
Hikma Pharmaceuticals PLC has recently finalized the acquisition of Xellia Pharmaceuticals' US finished dosage form business and related assets for USD 135 million in cash. It is subject to standard adjustments. Additionally, up to USD 50 million may be payable in contingent consideration based on certain regulatory and commercial milestones.
Company Outlook
Hikma Pharmaceuticals now expects group revenue growth of 6% to 8%, with core operating profit expected between USD 700 million and USD 730 million. Injectables revenue is anticipated to increase by 6% to 8%, while Branded revenue is forecasted to grow in the high single digits. The growth outlook for Generics revenue has been revised to 5% to 7%. The company also maintains a core net finance expense of approximately USD 91 million and plans capital expenditures in the range of USD 140 million to USD 160 million.
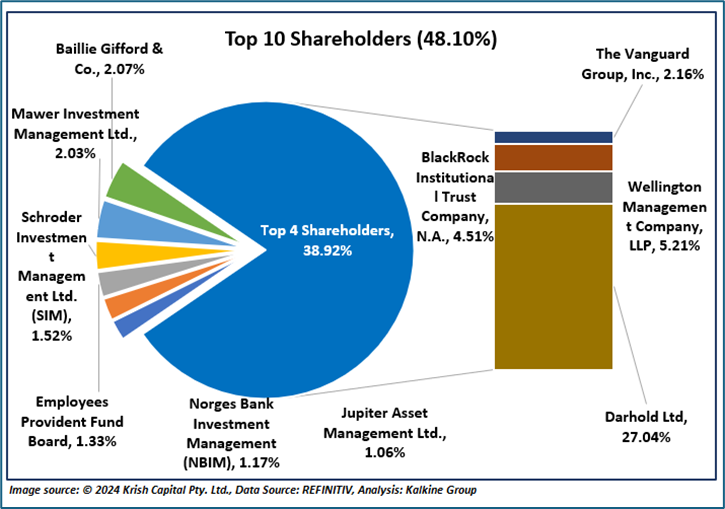
Top 10 Shareholders:
The top 10 shareholders account for approximately 48.10% of the total shares. Darhold Ltd holds the largest stake at around 27.04%, followed by Wellington Management Company, LLP, which holds about 5.21%. This distribution is illustrated in the chart below:
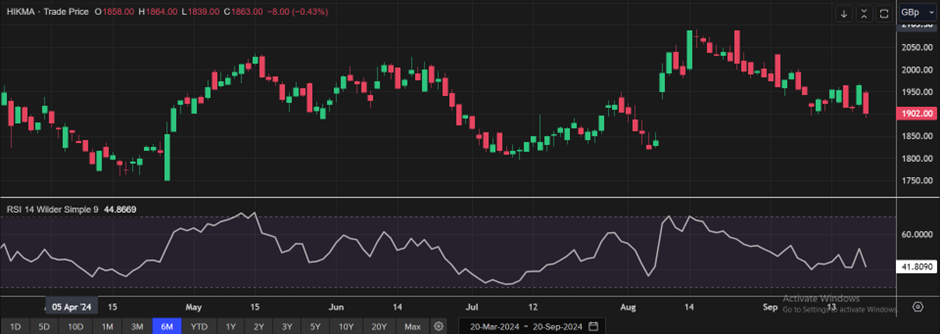
Stock Information
The stock has experienced a decline of approximately 6.76% over the past month and a decrease of around 0.70% over the last six months. Its 52-week low and high are GBX 1,711.00 and GBX 2,165.00, respectively, and it is currently trading below the average of these 52-week highs and lows.
Note 1: Past performance is not a reliable indicator of future performance.
Note 2: The reference data for all price data, currency, technical indicators, support, and resistance levels is 20 September 2024. The reference data in this report has been partly sourced from EODHD/Others.


 Please wait processing your request...