_01_19_2024_06_51_39_919940.jpg)
Image source: Shutterstock
Highlights
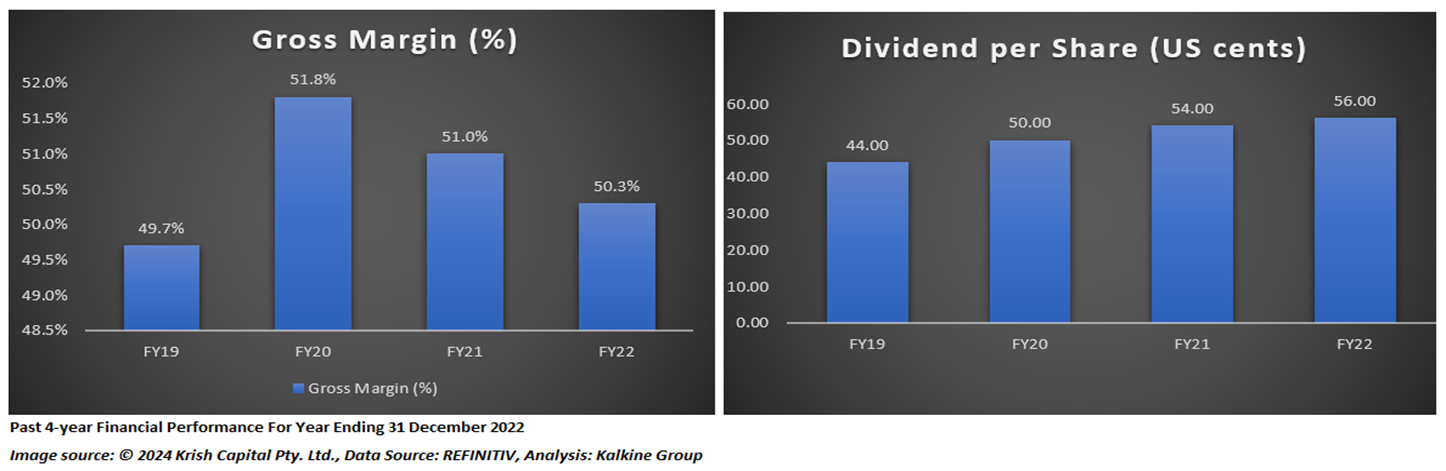
- In H1 FY23, HIK registered 31.6% surge in interim dividend as compared to the previous corresponding period.
- Its revenue increased to USD 43 billion in H1 FY23, marking approximately 17.6% year-on-year (YoY) growth from USD 1.21 billion in H1 FY22.
- The firm is expecting its generics revenue to be in the range of USD 920 million and USD 940 million for FY23.
FTSE 100 listed Hikma Pharmaceuticals PLC (LSE: HIK) is a pharmaceuticals and biotechnology firm involved in manufacturing a suite of branded and non-branded generic medicines.
In the first half of FY23, the firm registered 31.6% surge in interim dividend as compared to the previous corresponding period. It paid an interim dividend of 25 US cents per share in September 2023, with the ex-dividend date of 10 August 2023.
Its revenue increased to USD 1.43 billion in H1 FY23, marking approximately 17.6% year-on-year (YoY) growth from USD 1.21 billion in H1 FY22. Its core operating profit grew by 35.5% YoY to USD 401 million following strong performance by the Generics and Branded division.
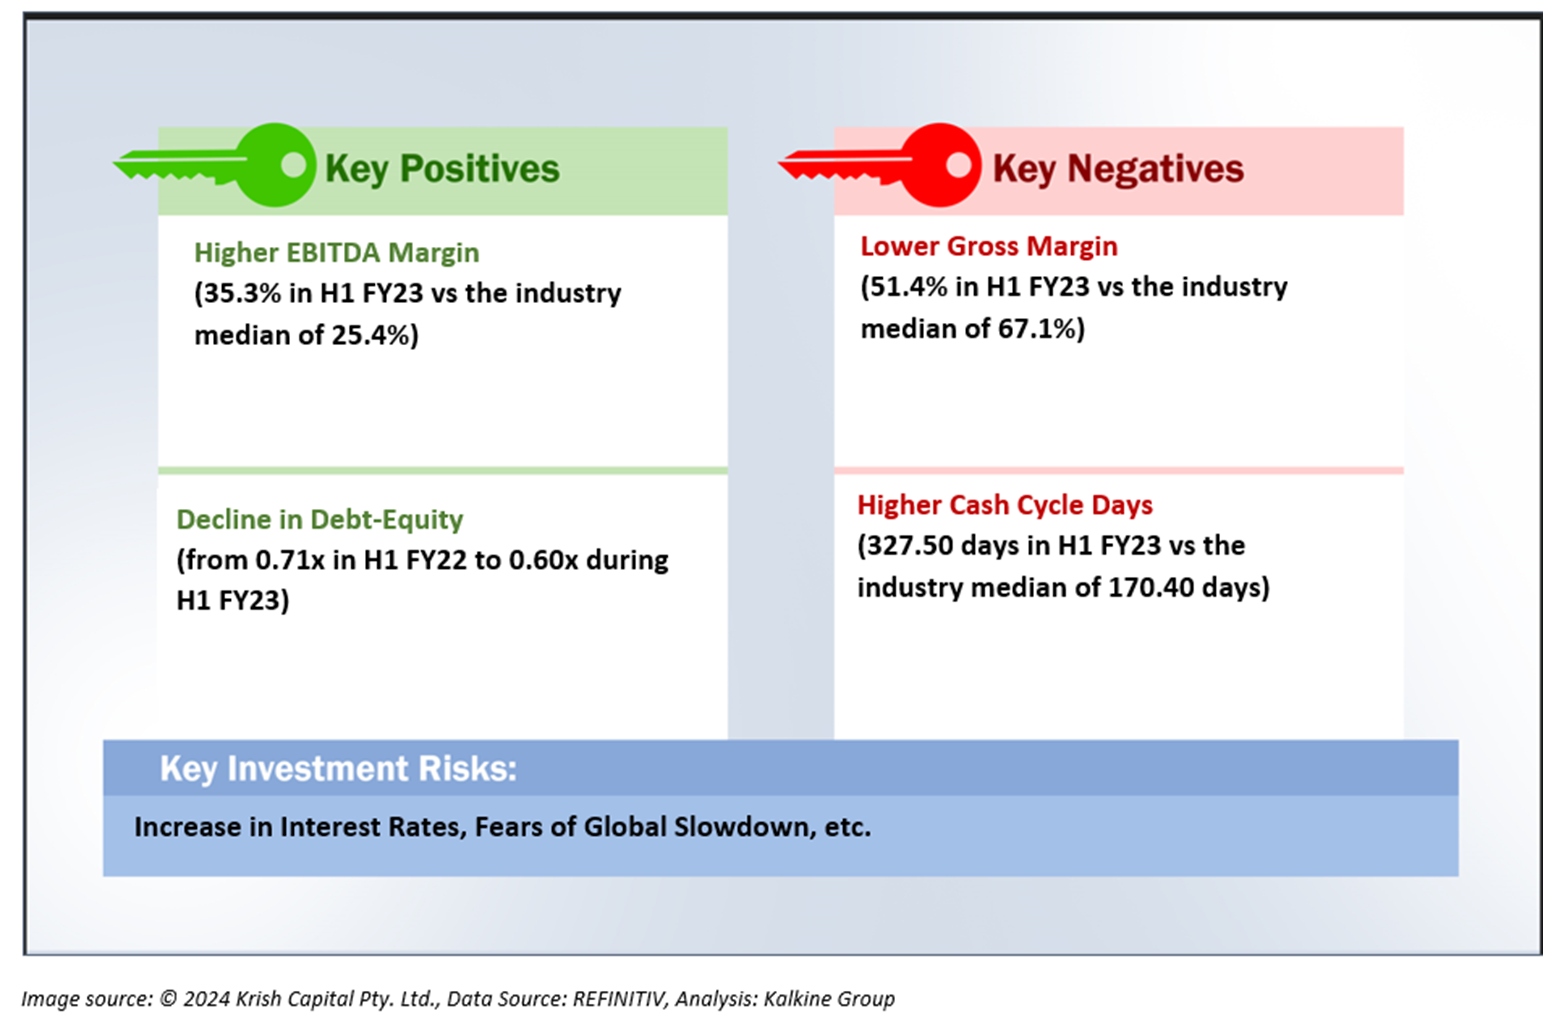
For the full fiscal year 2023, Hikma Pharmaceuticals is anticipating its revenue growth and core operating margin to be between 7%-9% and 36%-37%, respectively, for the Injectables division. For its Branded division, HIK is expecting its core operating margin to increase to 23% for the full year. The division’s Generics revenues is likley to be between USD 920 million and USD 940 million for FY23.
Also, it intends to make huge investments across the injectables business aiming further expansion of its portfolio as well as manufacturing capacity.
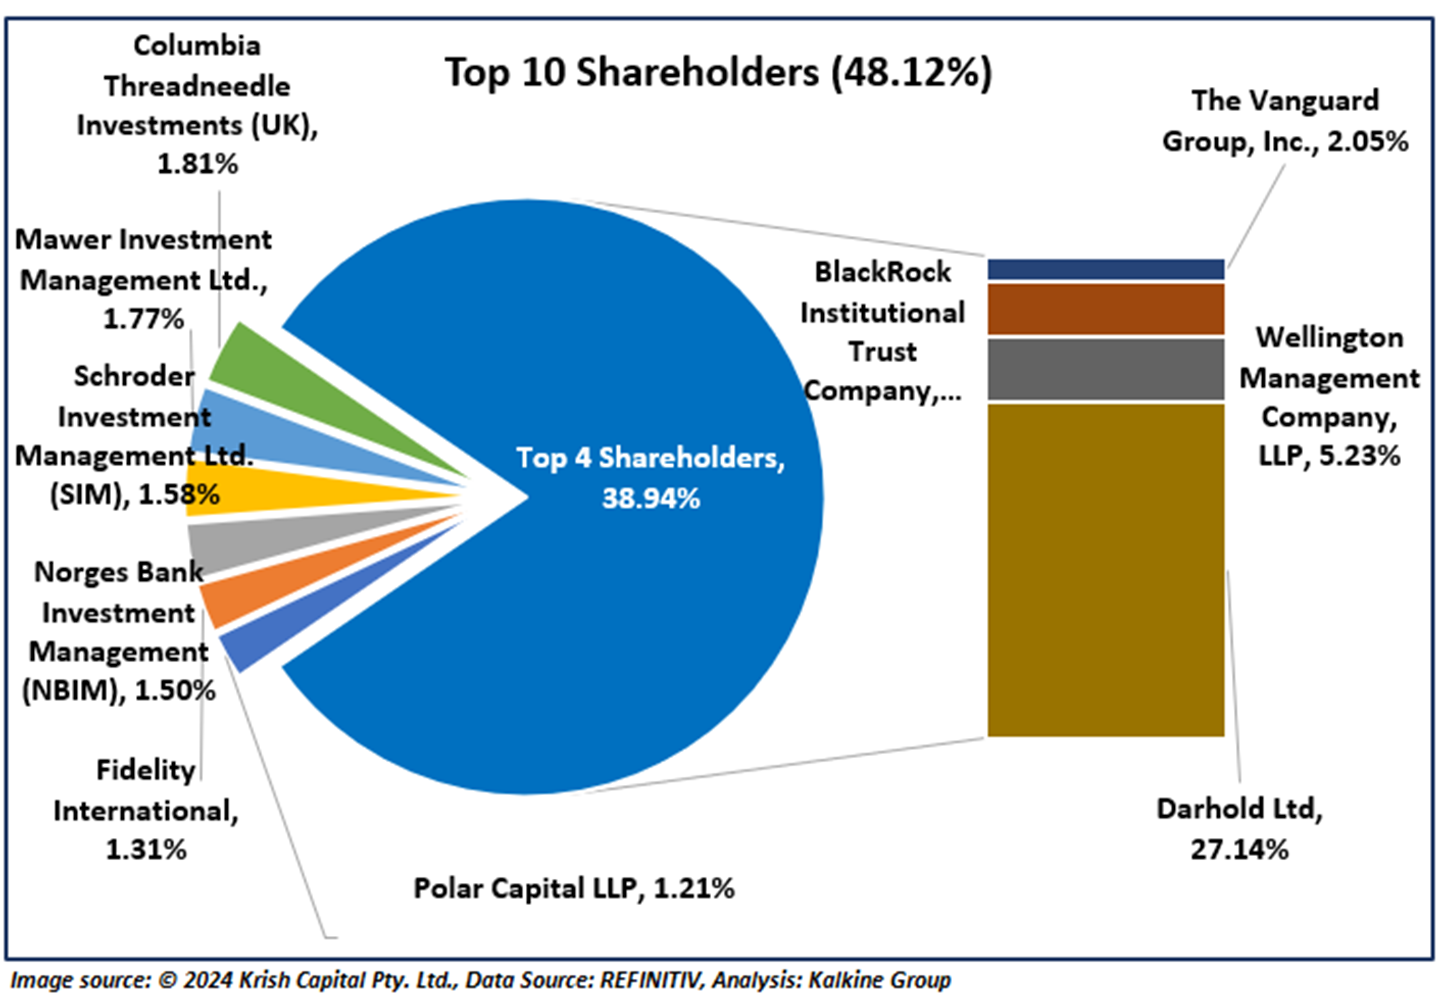
Top 10 Shareholders:
Around 48.12% of the total shareholdings in HIK is held by its top ten shareholders. While Darhold Ltd is the biggest shareholder with 27.14% shareholding in HIK, Wellington Management Company, LLP is the second biggest shareholder with over 5.23% shareholding.
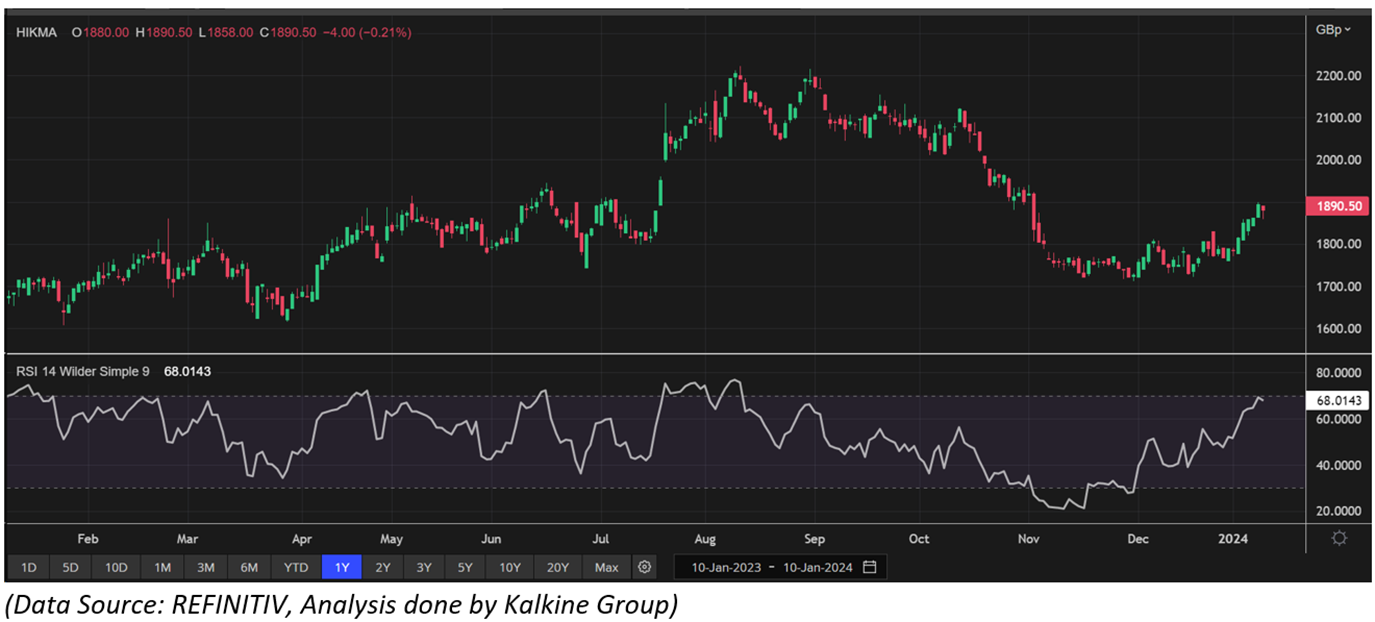
Stock Price Performance
HIK’s stock price has jumped by approximately 9.65% in the last one month. It has gained more than 5.28% over the last six months. The stock’s 52-week low and 52-week high price stand at GBX 1,607.50 and 2,222.00, respectively.
Note 1: Past performance is not a reliable indicator of future performance.
Note 2: The reference data for all price data, currency, technical indicators, support, and resistance levels is 10 January 2024. The reference data in this report has been partly sourced from EODHD/Others.


 Please wait processing your request...