
Image source: Shutterstock
Highlights
- Howden Joinery delivered decent FY24 results with UK market share gains and 9.7% international revenue growth despite market headwinds
- Declared a final dividend of GBX 21.2 per share, equating to a 2.53% yield based on the 16 May 2025 share price
- Plans GBPX 125 million capex in 2025 to support depot expansion, digital tools, and operational efficiency amidst expected UK market softness
Howden Joinery Group PLC (LSE: HWDN) is a UK-based FTSE 100 kitchen and joinery supplier, serving trade customers through 850 UK depots and 75 international depots across France, Belgium, and Ireland.
Howden Joinery Group reported a resilient FY24 performance, driven by UK market share gains and 9.7% international revenue growth in local currency despite broader market challenges. The results were further supported by strong operating cash inflows of GBP 504.6 mn and a reduction in tax payments (GBP 39.2mn vs GBP 63.5mn in the prior year). While profit after tax saw a slight decline, it was supported by GBP 6.7 mn in net finance income and a GBP 1.6mn tax credit related to the amortisation of acquired intangibles.
The company’s management has declared a final dividend of GBX 21.2 per share, which is scheduled to be paid on 23 May 2025. This brings the annualised dividend yield to around 2.53% as per the closing price on 16 May 2025.
Company Outlook
Howden Joinery expects a weaker UK kitchen market in 2025 but aims to offset this through depot growth, pricing strategy, and efficiency measures. Around GBP 125mn in capex will fund expansion, upgrades, and a new system to enhance salesforce productivity and customer engagement.
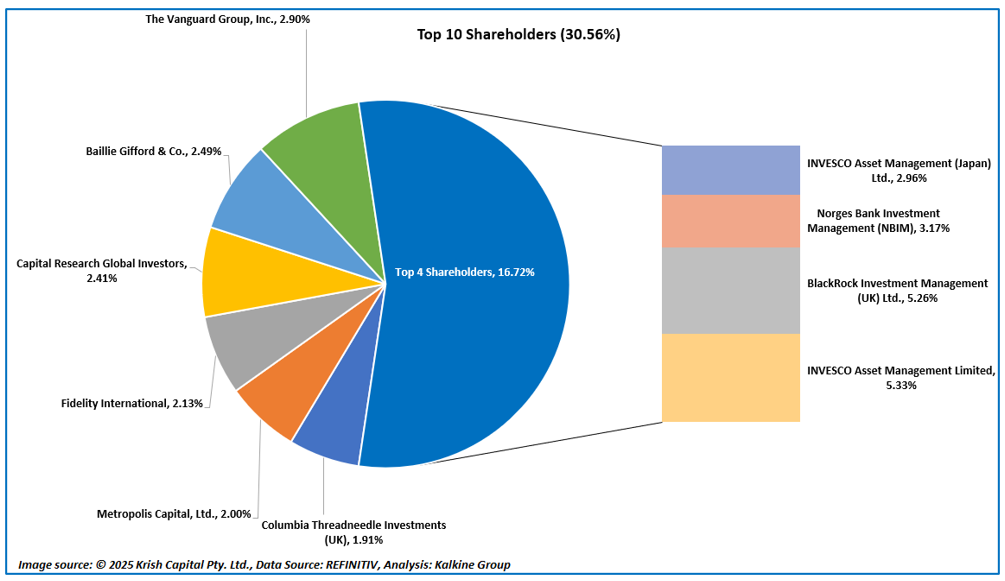
Top 10 Shareholders of HWDN
The top 10 shareholders of HWDN collectively form ~30.56% of the total shareholdings. INVESCO Asset Management Limited holds the maximum number of shares with ~5.33% shareholding, followed by BlackRock Investment Management (UK) Ltd. with ~5.26% shareholding, as depicted in the chart below:
Stock Information
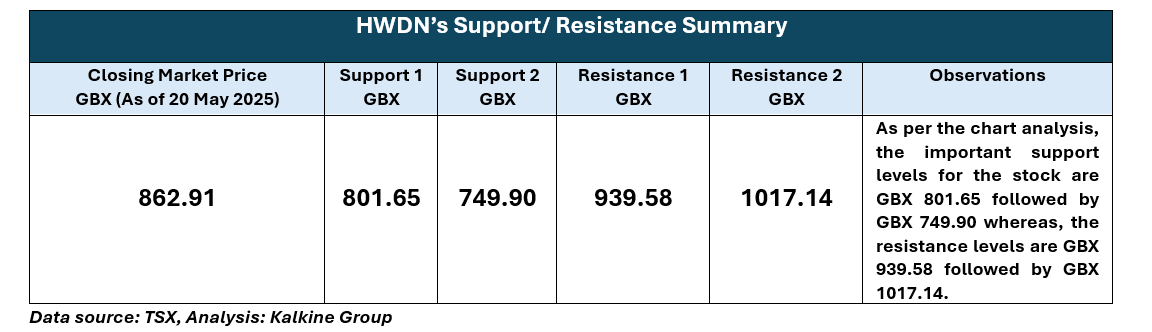
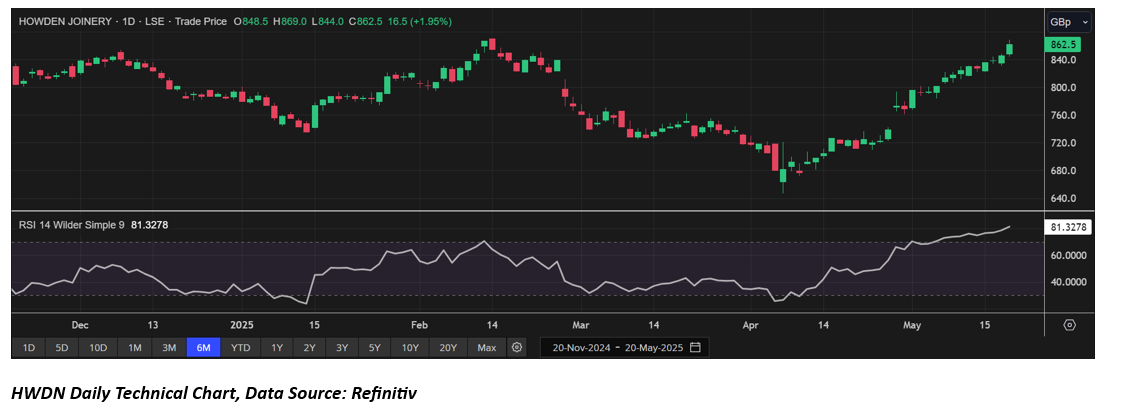
The stock of HWDN has witnessed a rise of ~21.11% in the past month and 6.66% in the past six months. The stock has a 52-week low and 52-week high of GBX 647.10 & GBX 982.50 respectively and is currently trading above the average of 52-week high-low, with a closing price of GBX 862.91 as of 21 May 2025.
Note 1: Past performance is not a reliable indicator of future performance.
Note 2: The reference data for all price data, currency, technical indicators, support, and resistance levels is 20 May 2025. The reference data in this report has been partly sourced from EODHD/Others.
Technical Indicators Defined
Support: A level at which the stock prices tend to find support if they are falling, and a downtrend may take a pause backed by demand or buying interest. Support 1 refers to the nearby support level for the stock and if the price breaches the level, then Support 2 may act as the crucial support level for the stock.
Resistance: A level at which the stock prices tend to find resistance when they are rising, and an uptrend may take a pause due to profit booking or selling interest. Resistance 1 refers to the nearby resistance level for the stock and if the price surpasses the level, then Resistance 2 may act as the crucial resistance level for the stock.


 Please wait processing your request...