
Image source: Shutterstock
Highlights
- IG Group’s H1FY25 total revenue surged by 12.3% YoY, reaching GBP 451.7 million, driven by higher client activity and market volatility
- Adjusted profit before tax for H1FY25 rose by 29.7% YoY, reaching GBP 266.8 million, supported by cost reductions
- On 3 February 2025, IG launched a third tranche of its share buyback program, valued at up to GBP 50 million.
- IG's management is confident in meeting FY25 revenue and profit targets.
IG Group Holding PLC (LSE:IGG) is a UK-based fintech company listed on the FTSE 250, offering online trading platforms, OTC leveraged derivatives, exchange-traded derivatives, stock trading, and investment services.
In the first half of the financial year 2025 (H1FY25), IG Group’s total revenue increased by 12.3% year-on-year, reaching GBP 451.7 million compared to GBP 402.4 million in H1FY24. This growth was primarily driven by higher client activity, heightened market volatility in Q1FY25, and double-digit revenue growth across all divisions. Notably, stock trading saw a 20% rise, and exchange-traded derivatives grew by 23% in H1FY25, contributing significantly to the overall revenue increase.
Adjusted profit before tax for H1FY25 rose by 29.7% YoY, reaching GBP 266.8 million, up from GBP 205.7 million in H1FY24. This increase was supported by a 1% decrease in adjusted operating costs, which fell to GBP 277.4 million. The cost reductions were driven by a 5% cut in fixed remuneration and a 25% drop in revenue-related costs, which contributed to improved profitability in the first half of the financial year.
Recent Business Update
On 3 February 2025, IG Group Holdings announced the launch of the third tranche of its share buyback program, amounting to upto GBP 50 million. This follows the announcement of a GBP 150 million program in July 2024 and a GBP 50 million extension in January 2025. The primary objective of this initiative is to reduce the company's share capital, with the buyback tranche set to run from 3 February to a deadline of 10 June 2025.
Company Outlook
IG Group’s management has indicated that current trading is “satisfactory” and has expressed confidence in meeting its FY25 revenue and profit targets. The company reported GBP 1,048 million in own funds and GBP 658 million in capital headroom above regulatory requirements, providing good financial flexibility for the remainder of FY25. With a new CFO and leadership changes focused on performance, IG is aligning talent and incentives to drive high-growth strategies. Efficiency initiatives, including the closure of Spectrum and onboarding improvements, are expected to generate scalable cost benefits in H2 and beyond, supporting FY25 goals.
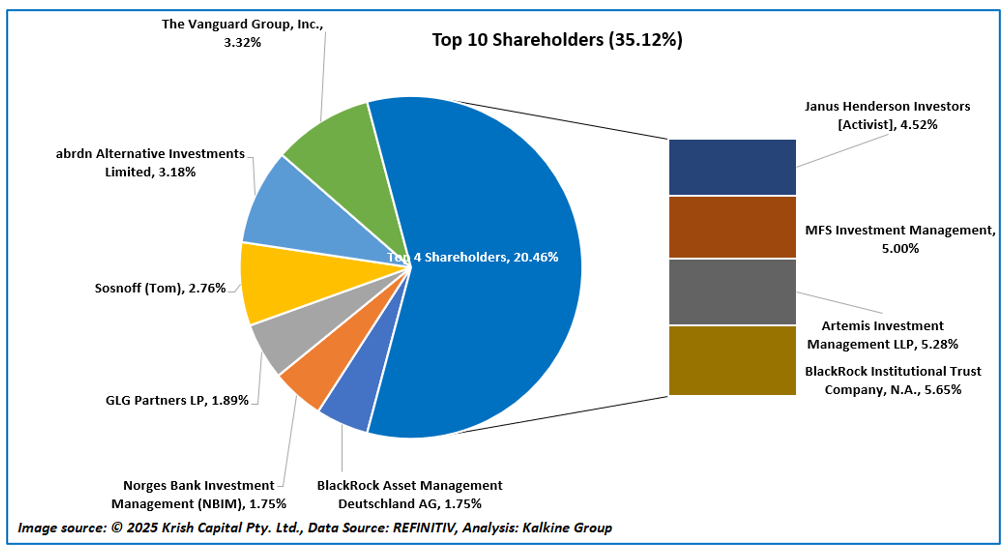
Top 10 Shareholders
The top 10 shareholders of IG Group hold approximately 35.12% of the total shares. The largest shareholder is BlackRock Institutional Trust Company, N.A., with around 5.65%, followed by Artemis Investment Management LLP, holding approximately 5.28%.
Stock Information
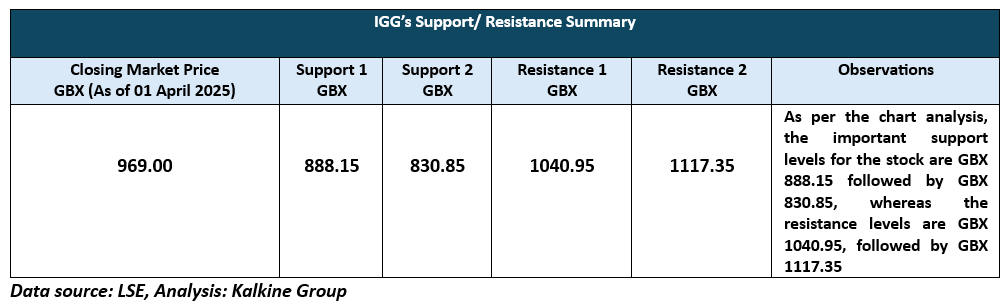
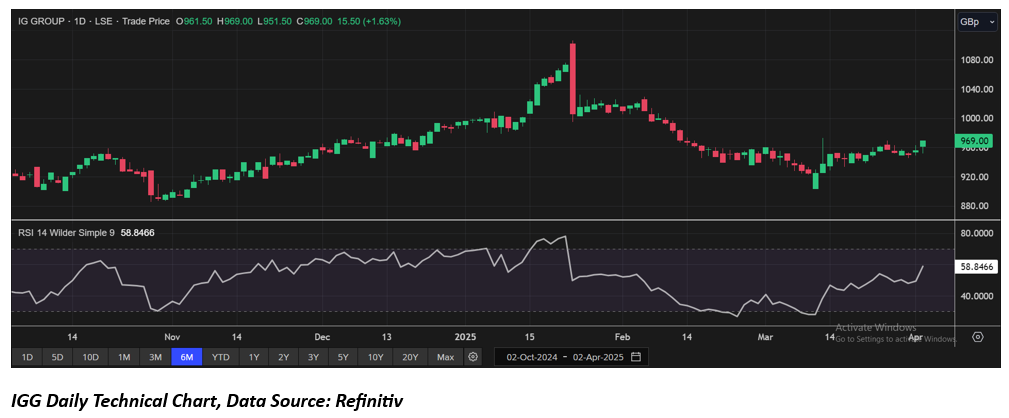
The stock has dropped by approximately 2.17% over the past three months but has risen by around 5.15% over the last six months. With a 52-week low of GBX 680.00 and a 52-week high of GBX 1,106.00, the stock is currently trading above the average of these values. Its closing price stands at GBX 969.00 as of 01 April 2025.
Note 1: Past performance is not a reliable indicator of future performance.
Note 2: The reference data for all price data, currency, technical indicators, support, and resistance levels is 01 April 2025. The reference data in this report has been partly sourced from EODHD/Others.
Technical Indicators Defined
Support: A level at which the stock prices tend to find support if they are falling, and a downtrend may take a pause backed by demand or buying interest. Support 1 refers to the nearby support level for the stock and if the price breaches the level, then Support 2 may act as the crucial support level for the stock.
Resistance: A level at which the stock prices tend to find resistance when they are rising, and an uptrend may take a pause due to profit booking or selling interest. Resistance 1 refers to the nearby resistance level for the stock and if the price surpasses the level, then Resistance 2 may act as the crucial resistance level for the stock.


 Please wait processing your request...