
Highlights
- IWG reported 1HFY25 revenue of USD 1,850.0 million, down 1.1% year-on-year.
- Net income declined to USD 8.0 million in 1H, an 11.1% annual decrease.
- Asset turnover improved to 0.19x in H1, versus the 0.04x industry median.
International Workplace Group PLC (LSE:IWG), based in Switzerland and part of the FTSE 250 index, operates in the real estate segment with brands such as Regus, Spaces, Signature, HQ, and Basepoint.
For the half-year ended 30 June 2025 (1HFY25), IWG reported revenue of USD 1,850.0 million, compared with USD 1,871.0 million in the same period of FY24, reflecting a year-on-year decrease of 1.1%. Net income for 1HFY25 stood at USD 8.0 million, down from USD 9.0 million in 1HFY24, a decline of 11.1% year-on-year. Gross profit reached USD 481.0 million in 1HFY25, compared with USD 471.0 million in 1HFY24, marking a 2.1% increase year-on-year.
Key positives include a higher asset turnover ratio of 0.19x in H1 FY25 compared with the industry median of 0.04x. Another positive is lower cash cycle days of 91.70 days in H1 FY25 compared with the industry median of 101.30 days.
Key negatives include a decline in gross margin to 26.00% in H1 FY25 compared with 60.70% in H1 FY24. Another negative is a decline in EBITDA margin, which stands at 11.90% in H1 FY25 versus an industry median of 46.90%.
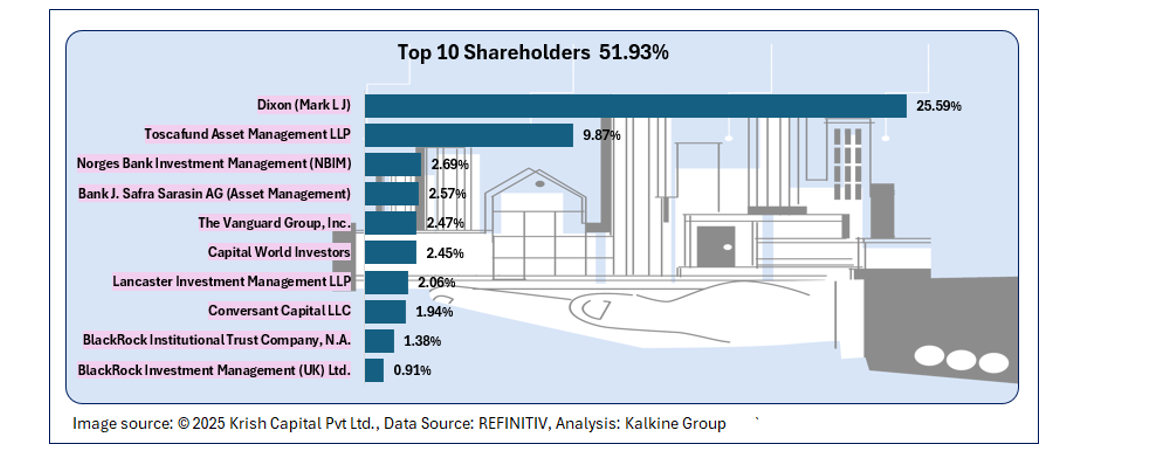
Top 10 Shareholders
The top ten shareholders collectively account for around 51.93% of the total equity. Dixon (Mark L J) Limited and Toscafund Asset Management LLP hold the largest positions at roughly 25.59% and 9.87%, respectively.
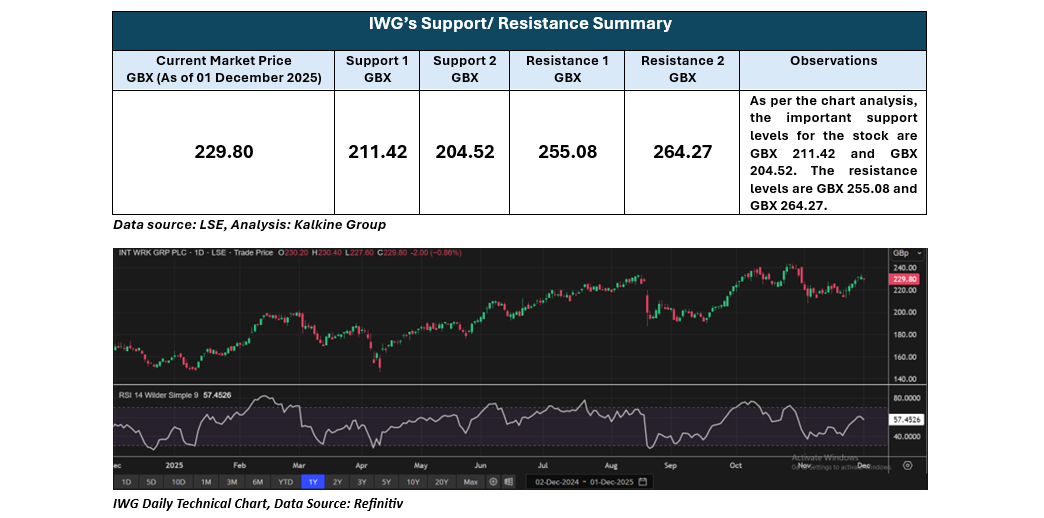
Stock Information
The share price of IWG has risen by about 2.30% over the past week and by approximately 12.14% over the past three months. The stock’s 52-week range stands between GBX 243.40 and GBX 146.00, and it is currently trading above the midpoint of this range.
Note 1: Past performance is not a reliable indicator of future performance.
Note 2: The reference data for all price data, currency, technical indicators, support, and resistance levels is 01 December 2025. The reference data in this report has been partly sourced from EODHD/Others.
Technical Indicators Defined
Support: A level at which the stock prices tend to find support if they are falling, and a downtrend may take a pause backed by demand or buying interest. Support 1 refers to the nearby support level for the stock and if the price breaches the level, then Support 2 may act as the crucial support level for the stock.
Resistance: A level at which the stock prices tend to find resistance when they are rising, and an uptrend may take a pause due to profit booking or selling interest. Resistance 1 refers to the nearby resistance level for the stock and if the price surpasses the level, then Resistance 2 may act as the crucial resistance level for the stock.


 Please wait processing your request...