
Image source: © Kuprevich | Megapixl.com
Highlights
- Legal & General Group PLC (LSE: LGEN) is a financial services company involved in the provision of risk, savings and investment management products and services.
- In the first half of the fiscal year 2023, the company’s Solvency II coverage ratio has soared to 230% from 212% in pcp.
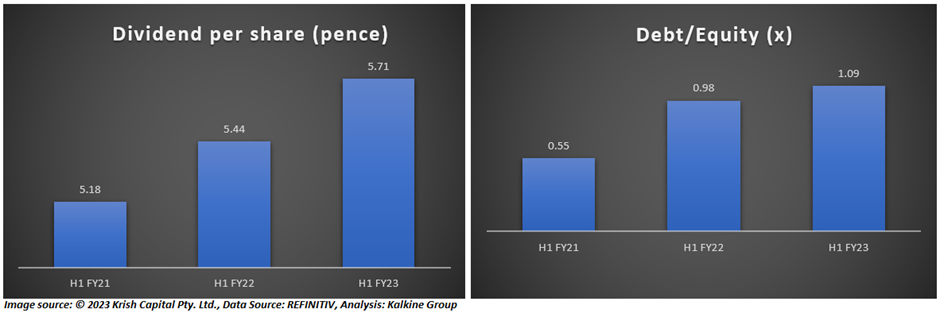
- The company has paid an interim dividend of 5.71 pence per share in September 2023, with the ex-dividend date of 24 August 2023.
FTSE 100 index listed Legal & General Group PLC (LSE: LGEN) is a financial services company involved in the provision of risk, savings and investment management products and services.
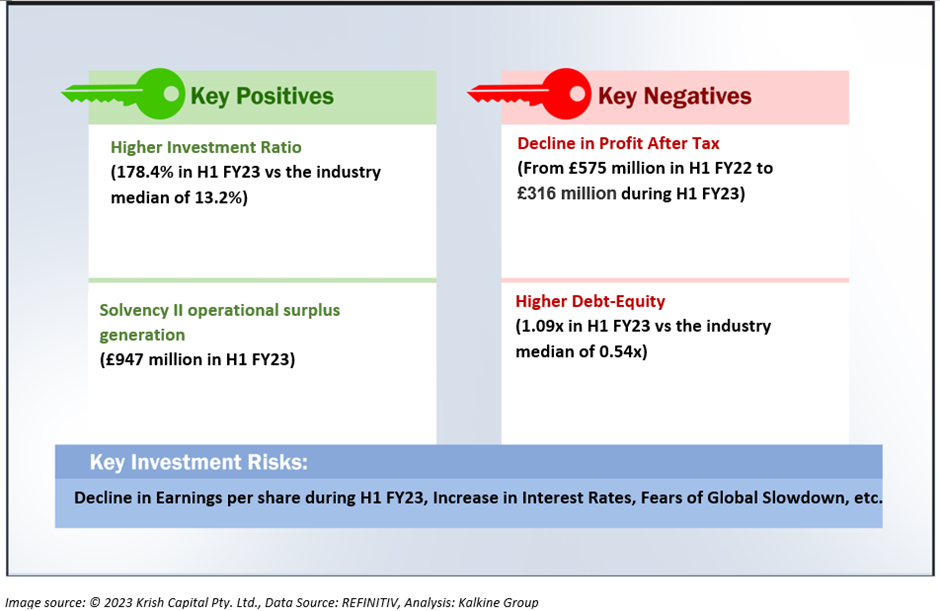
In the first half of the fiscal year 2023, the company’s Solvency II coverage ratio has soared to 230% from 212% in the previous corresponding period. LGEN has a net surplus generation over dividends of £0.6 billion for the reporting period.
The company has paid an interim dividend of 5.71 pence per share in September 2023, with the ex-dividend date of 24 August 2023.
The company's Capital Division, LGC, aims to increase shareholder alternative AUM to £5 billion by 2025, with a blended portfolio return of 10-12%. The third-party AUM for LGC is expected to be between £25 and £30 billion, while the operating profit will range between £600 and £700 million by 2025.
Furthermore, Legal & General Group is anticipating its dividend to witness a growth of 5% per annum to fiscal year 2024.
For H1 FY23, the company secured £947 million in capital generation and continue to be on track to achieve five-year cumulative target of £8.0 billion - £9.0 billion. Also, LGEN is aiming mid-single digit growth in revenues for its United Kingdom protection businesses.
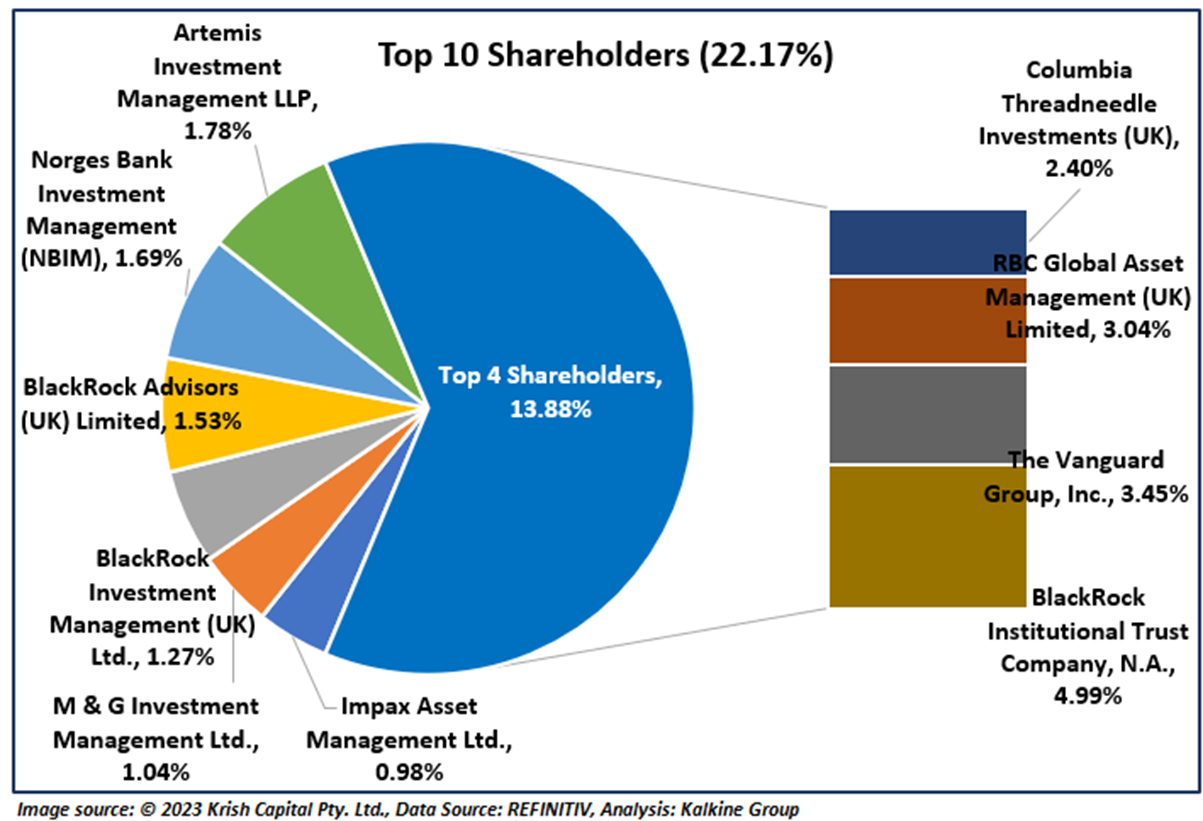
Top 10 shareholders
Around 22% of the total shareholdings are held by its top ten shareholders. While BlackRock Institutional Trust Company, N.A. holds the maximum number of shares with over 4.99% shareholding, the Vanguard Group, Inc. holds over 3.45% shareholding.
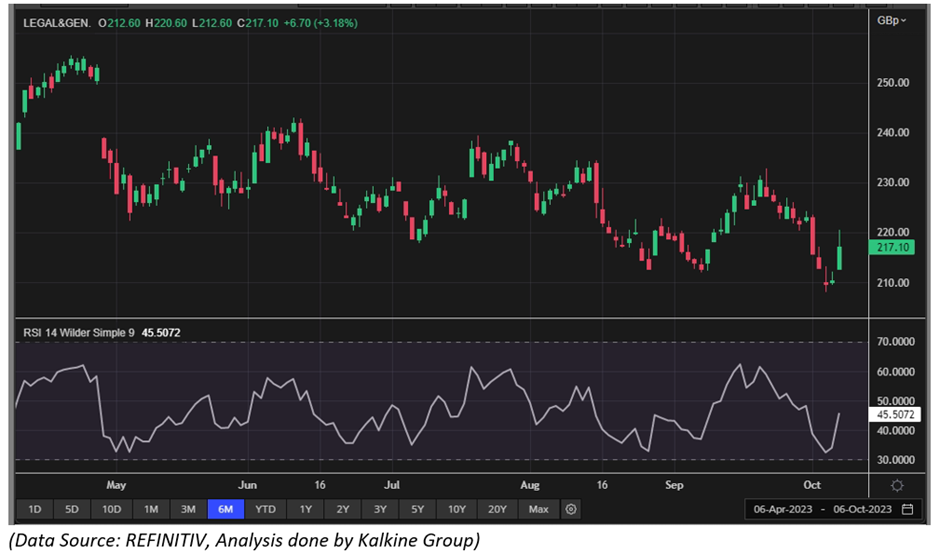
Stock price Performance
LGEN’s stock price has dropped by 2.06% in the last one month. It has gone down by over 13.29% over the last six months. The stock’s 52-week low and high price stand at GBX 191.37 & GBX 311.13, respectively.
Note 1: Past performance is not a reliable indicator of future performance.
Note 2: The reference data for all price data, currency, technical indicators, support, and resistance levels is 06 October 2023. The reference data in this report has been partly sourced from EODHD/Others.


 Please wait processing your request...