
Highlights
- JHD’s H1FY25 revenue fell 4.7% YoY due to subdued government spending in key markets and weaker consumer confidence.
- The company declared an interim dividend of GBX 2.75 per share on 27 March 2025, up 10% YoY.
- JHD remains debt-free with GBP 63.7 million in cash, supporting capex innovation and market expansion.
James Halstead PLC (LSE: JHD), is a UK-based manufacturer and global distributor of floor coverings, operating across the UK, Europe, Scandinavia, Australasia, Asia, and other international markets.
In the first half of the financial year 2025 (H1FY25), the company’s revenue declined by 4.7% YoY to GBP 130.09 million, due to subdued government spending in key markets and weaker consumer confidence. Operating profit rose by 3.2% YoY to GBP 27.06 million, driven by cost discipline, lower overheads, improved gross margin, and stable raw material and energy costs. Profit after tax edged up 0.1% YoY to GBP 20.09 million, supported by a higher operating base and a slightly lower effective tax rate of 26.3%.
Recent Business Update
The company declared an interim dividend of GBX 2.75 per share on 27 March 2025, marking a 10% YoY increase, supported by stable profitability, cash flow visibility, and confidence in business momentum heading into H2FY25.
Company Outlook
In January 2025, JHD reported a 9% YoY rise in UK sales, reflecting demand recovery in public infrastructure sectors like healthcare and education. Inventory build-up in H1FY25, driven by early 2025 trade show launches, is expected to aid volume recovery and inventory turnover in H2FY25.
JHD remains debt-free with GBP 63.7 million in cash, supporting capex, innovation, and market expansion.
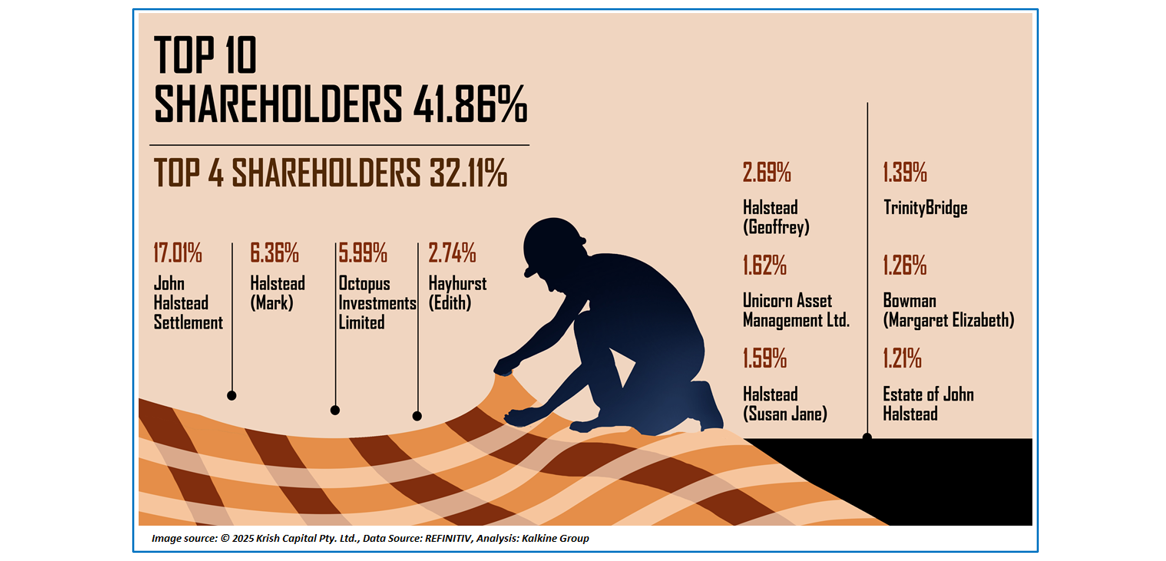
Top 10 Shareholders
The top 10 shareholders of JHD together form ~41.86% of the total shareholding. John Halstead Settlement and Halstead (Mark) hold a maximum stake in the company at ~17.01% and ~6.36%, respectively.
Stock Information
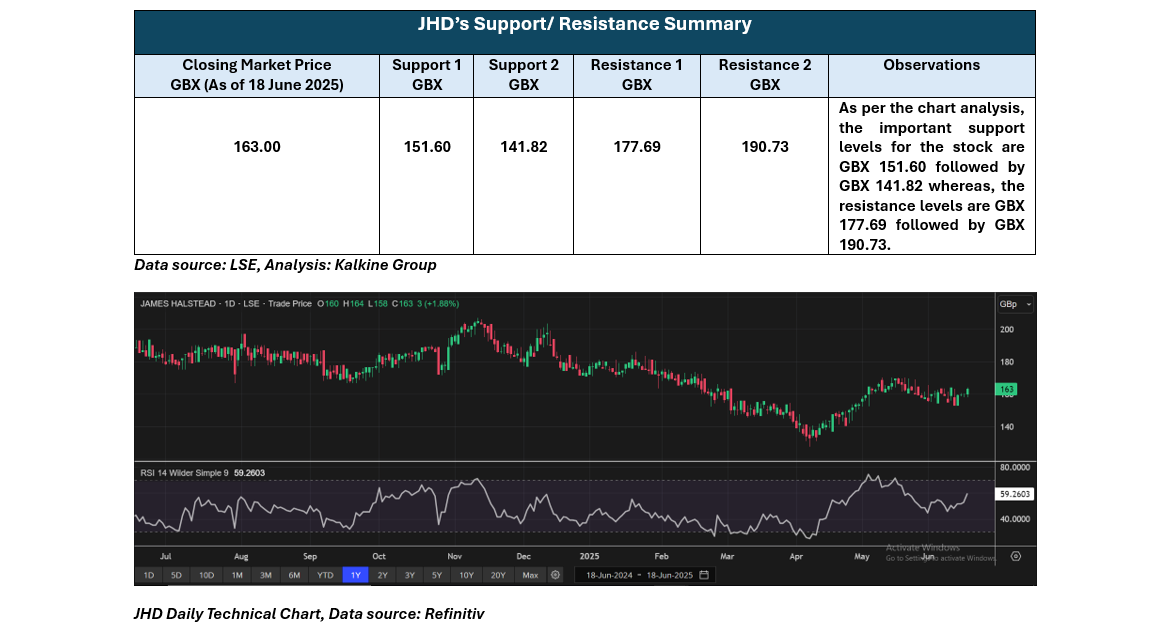
The stock price of JHD has gained approximately 8.30% over the past three months but remains down by around 9.19% over the last six months. The stock's 52-week range spans from a low of GBX 127.50 to a high of GBX 207.00. As of 18 June 2025, it closed at GBX 163.00.
Note 1: Past performance is not a reliable indicator of future performance.
Note 2: The reference data for all price data, currency, technical indicators, support, and resistance levels is 18 June 2025. The reference data in this report has been partly sourced from EODHD/Others.
Technical Indicators Defined
Support: A level at which the stock prices tend to find support if they are falling, and a downtrend may take a pause backed by demand or buying interest. Support 1 refers to the nearby support level for the stock and if the price breaches the level, then Support 2 may act as the crucial support level for the stock.
Resistance: A level at which the stock prices tend to find resistance when they are rising, and an uptrend may take a pause due to profit booking or selling interest. Resistance 1 refers to the nearby resistance level for the stock and if the price surpasses the level, then Resistance 2 may act as the crucial resistance level for the stock.


 Please wait processing your request...