
Image source: © 2025 Krish Capital Pty.Ltd
Highlights
- JSG’s FY24 revenue rose by 10.3% YoY, while adjusted EBITDA surged by 16.0% YoY.
- JSG began 2025 with higher customer retention and a focus on regional sales expansion.
- JSG continued to invest in capacity at Crawley, Wexford, and Naas to meet growing HORECA and healthcare demand.
Johnson Service Group PLC (LSE: JSG) provides textile rental and related services across the UK and Ireland, with its Johnsons Workwear division leading in workwear and protective clothing.
In the financial year (FY24), the company’s revenue increased by 10.3% YoY to GBP 513.40 million, driven by a 15.0% increase in HORECA sales to GBP 371.2 million, supported by both price increases and higher volumes. Adjusted EBITDA surged by 16.0% YoY to GBP 152.60 million due to improvements in both the HORECA and Workwear segments. The adjusted operating profit rose by 23.4% YoY to GBP 62.30 million, driven by improved scale and operational efficiency.
Company Outlook
Johnson Service Group highlights that it remains on track to achieve its 14.0% adjusted operating margin target by 2026, driven by productivity gains, cost control, and volume growth. The company continued to invest in site capacity at Crawley, Wexford, and Naas, aiming to enhance efficiency and meet rising demand across HORECA and healthcare.
The Group began 2025 positively, maintaining higher customer retention while focusing on sales growth in regions with recent capacity expansions.
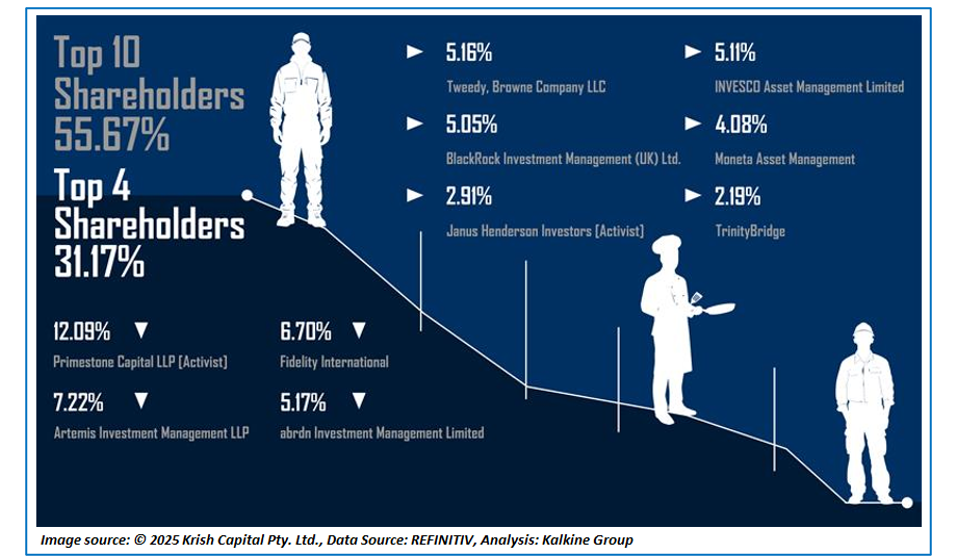
Top 10 Shareholder
The top 10 shareholders collectively hold approximately 55.67% of the company’s total shares, with Primestone Capital LLP [Activist] and Artemis Investment Management LLP being the largest shareholders, holding around 12.09% and 7.22%, respectively.
Stock Information
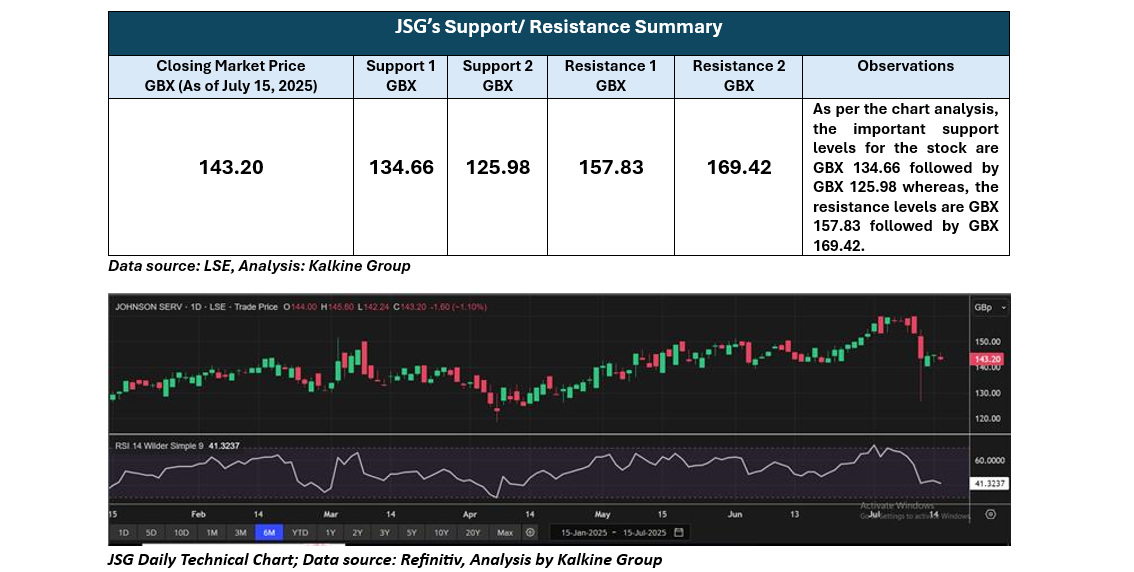
The stock has declined by approximately 8.43% over the past week and has risen by 12.40% over the past six months. As of 15 July 2025, the stock closed at GBX 143.2, trading above the average of the 52-week low of GBX 118.6 and the 52-week high of GBX 165.
Note 1: Past performance is not a reliable indicator of future performance.
Note 2: The reference data for all price data, currency, technical indicators, support, and resistance levels is 15 July 2025. The reference data in this report has been partly sourced from EODHD/Others.
Technical Indicators Defined
Support: A level at which the stock prices tend to find support if they are falling, and a downtrend may take a pause backed by demand or buying interest. Support 1 refers to the nearby support level for the stock and if the price breaches the level, then Support 2 may act as the crucial support level for the stock.
Resistance: A level at which the stock prices tend to find resistance when they are rising, and an uptrend may take a pause due to profit booking or selling interest. Resistance 1 refers to the nearby resistance level for the stock and if the price surpasses the level, then Resistance 2 may act as the crucial resistance level for the stock.


 Please wait processing your request...