
Highlights
- NG’s FY25 operating profit increased by 10.3% YoY, primarily driven by improved performance across regulated segments.
- The company completed the sale of its National Grid Renewables business to Brookfield and partners on May 30, 2025.
- It expects EPS to grow at a 6–8% CAGR in FY26, supported by regulated business performance.
National Grid PLC (LSE: NG.) is an FTSE 100 Index-listed London-based electricity and gas utility entity focused on transmission and distribution activities.
In the financial year 2025 (FY25), the company’s operating profit increased by 10.3% YoY to GBP 4,934.00 million, primarily driven by improved performance across regulated segments, supported by new rate agreements and cost efficiencies. Profit before tax increased by 19.8% YoY to GBP 3,650.00 million, supported by higher operating income and a reduction in financing costs that lowered interest expenses. Earnings per share rose by 8.1% YoY to GBP 60.00 million, primarily driven by underlying performance across core operations, offsetting the impact of dilution.
Recent Business Update
The company announced the successful completion of the sale of its National Grid Renewables business to Brookfield Asset Management and its institutional partners, including Brookfield Renewable Partners, on May 30, 2025.
Company Outlook
The company expects EPS to increase in FY26 by 6–8% CAGR, driven by continued operational performance in its regulated business. Meanwhile, net debt is expected to rise by GBP 6 billion, with regulatory gearing projected to remain in the low to mid-60% range, supported by improved cash flows and divestment proceeds.
UK electricity transmission is expected to maintain approximately ~100 bps RoE outperformance in the final year of RIIO-T2, while UK electricity distribution is projected to improve toward an average outperformance of ~100 bps by the end of RIIO-ED2.
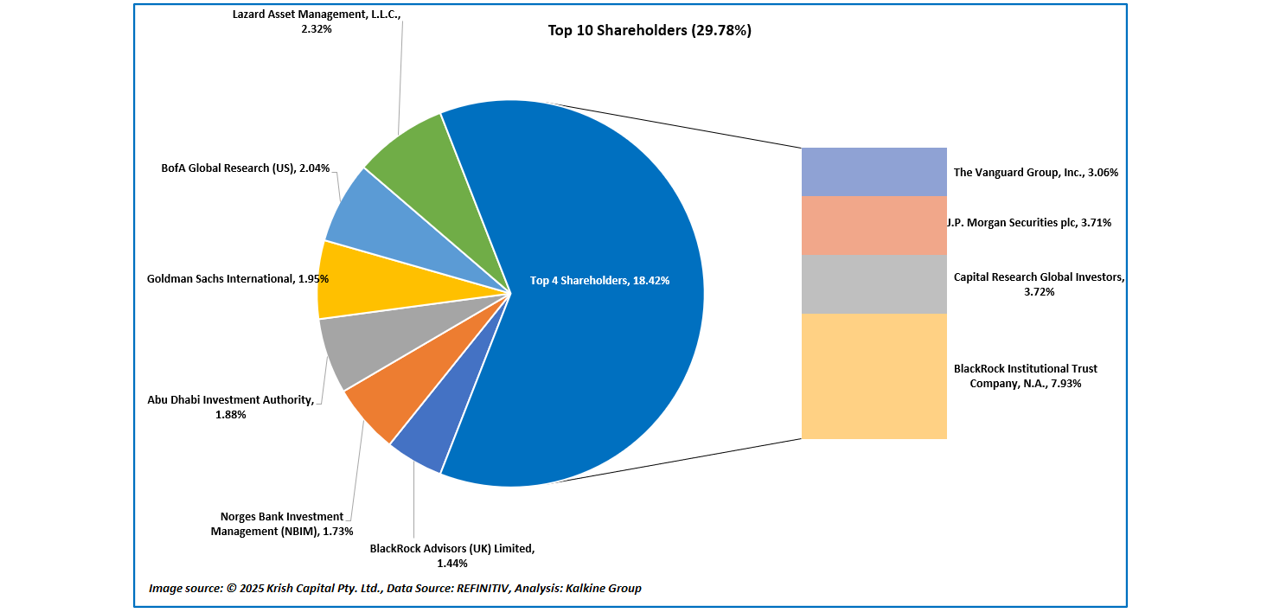
Top 10 Shareholders
The top 10 shareholders of National Grid together form ~29.78% of the total shareholding. BlackRock Institutional Trust Company, N.A., and Capital Research Global Investors hold a maximum stake in the company at ~7.93% and ~3.72%, respectively.
Stock Information
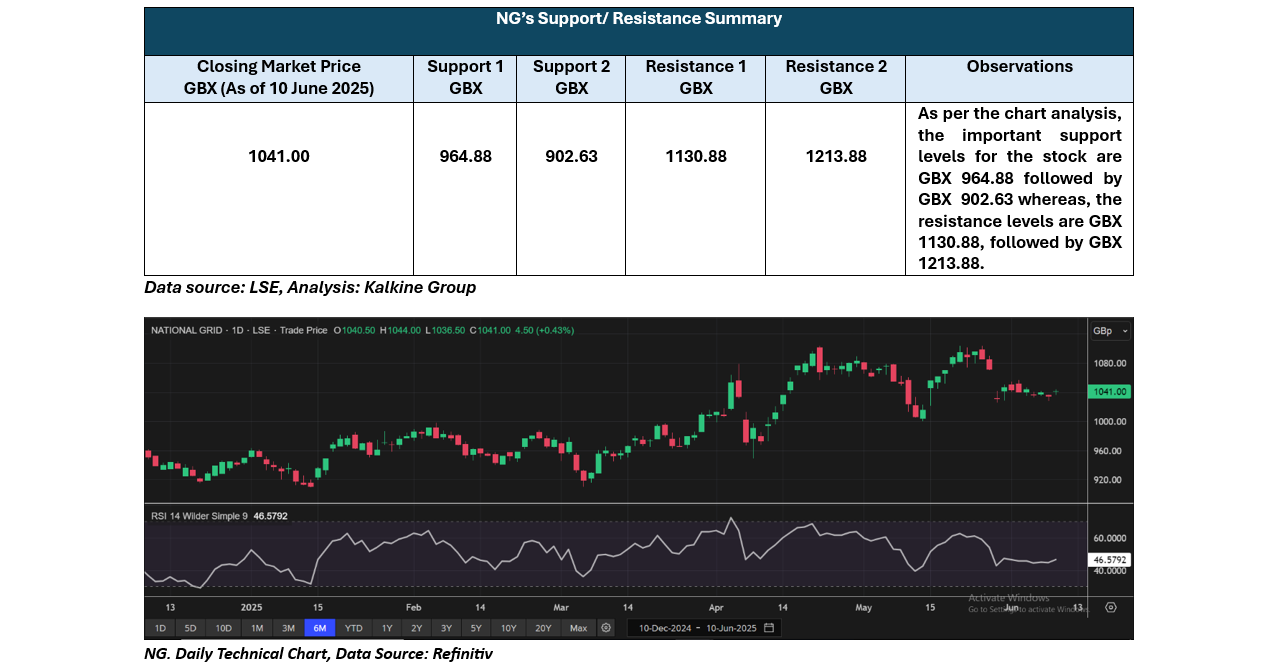
The stock has witnessed an upside of ~8.80% and ~9.39% over the last 3 months and 6 months, respectively. Moreover, it is trading below the average 52-week high price of GBX 1,103.50 and the 52-week low price of GBX 835.00, with a closing price of GBX 1041.0 as of 10 June 2025.
Note 1: Past performance is not a reliable indicator of future performance.
Note 2: The reference data for all price data, currency, technical indicators, support, and resistance levels is 10 June 2025. The reference data in this report has been partly sourced from EODHD/Others.
Technical Indicators Defined
Support: A level at which the stock prices tend to find support if they are falling, and a downtrend may take a pause backed by demand or buying interest. Support 1 refers to the nearby support level for the stock and if the price breaches the level, then Support 2 may act as the crucial support level for the stock.
Resistance: A level at which the stock prices tend to find resistance when they are rising, and an uptrend may take a pause due to profit booking or selling interest. Resistance 1 refers to the nearby resistance level for the stock and if the price surpasses the level, then Resistance 2 may act as the crucial resistance level for the stock.


 Please wait processing your request...