
Image source: © 2025 Krish Capital Pty.Ltd
Highlights
- N91’s FY25 AUM rose by 3.8% YoY, while net revenue increased by 1.1% YoY.
- The company completed the Sanlam Investments UK transfer to Ninety One UK on 16 June 2025.
- N91 starts the new financial year amid easing rates and inflation, supporting renewed market activity and growth opportunities.
Ninety One PLC (LSE: N91) is a FTSE 250-listed UK-based investment manager offering specialized strategies across equities, fixed income, multi-asset, and alternatives, alongside a South Africa-focused fund platform business.
In the financial year 2025 (FY25), the company’s assets under management (AUM) rose by 3.8% YoY to GBP 1,30,781.00 million, driven by net inflows from Africa, Europe, and the Asia-Pacific regions. Net revenue increased by 1.1% YoY to GBP 602.60 million, supported by institutional client inflows from Asia-Pacific and Africa. However, profit after tax (PAT) declined by 8.4% YoY to GBP 150.10 million, down from GBP 163.90 million in FY24, due to rising contribution expenses.
Recent Business Update
On 16 June 2025, N91 completed the transfer of Sanlam Investments UK’s active asset management business to Ninety One UK, as announced in November 2024 and March 2025. The move positions Ninety One UK as the primary manager for part of Sanlam’s UK assets, strengthening its market presence.
Company Outlook
N91 has entered the new financial year amid moderating inflation and easing interest rates, which have revived market participation, normalized risk appetite, and opened opportunities for capital reallocation and long-term growth strategies.
Top 10 Shareholder
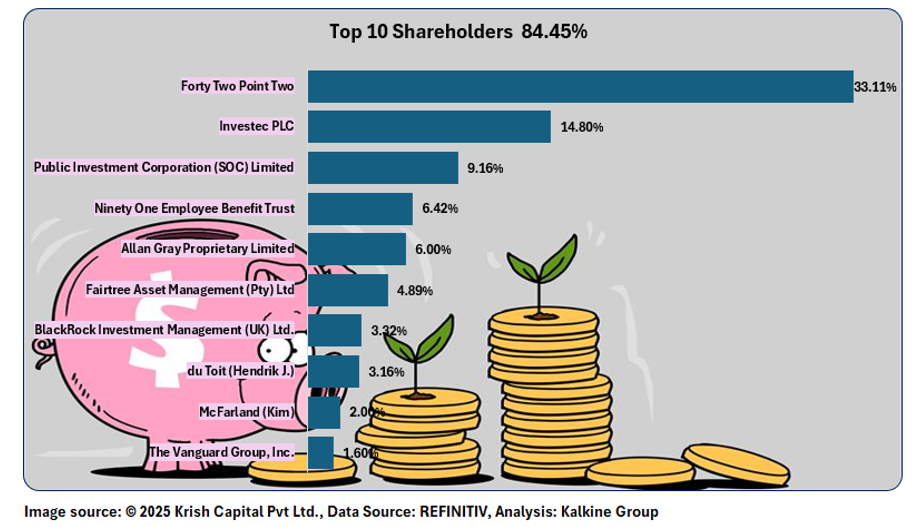
The top 10 shareholders collectively hold approximately 84.45% of Ninety One PLC’s total shares, with the largest stakes held by Forty Two Point Two (~33.11%) and Investec PLC (~14.80%).
Stock Information
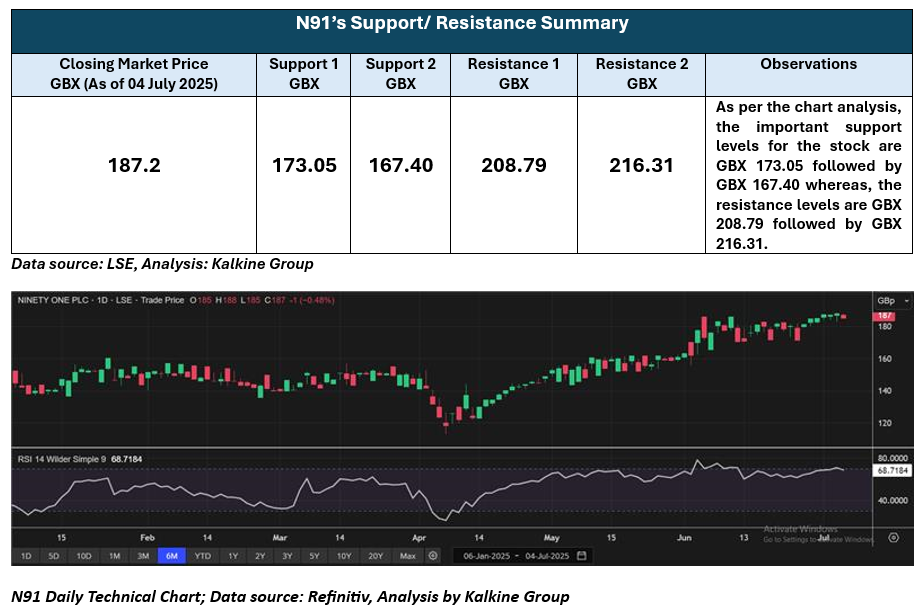
The stock has witnessed an upside of ~5.40% and ~28.04% over the past month and past 6 months, respectively. Moreover, it is trading above the average 52-week high price of GBX 199.3 and 52-week low price of GBX 113.2, with a closing price at GBX 187.2 as of 04 July 2025.
Note 1: Past performance is not a reliable indicator of future performance.
Note 2: The reference data for all price data, currency, technical indicators, support, and resistance levels is 04 July 2025. The reference data in this report has been partly sourced from EODHD/Others.
Technical Indicators Defined
Support: A level at which the stock prices tend to find support if they are falling, and a downtrend may take a pause backed by demand or buying interest. Support 1 refers to the nearby support level for the stock and if the price breaches the level, then Support 2 may act as the crucial support level for the stock.
Resistance: A level at which the stock prices tend to find resistance when they are rising, and an uptrend may take a pause due to profit booking or selling interest. Resistance 1 refers to the nearby resistance level for the stock and if the price surpasses the level, then Resistance 2 may act as the crucial resistance level for the stock.


 Please wait processing your request...