
Image source: Shutterstock
Highlights
- PSON’s FY24 revenue rose by 3.0% YoY, while adjusted operating profit increased by 10.0% YoY.
- The company initiated a GBP 350 million share buyback and recovered GBP 100 million in state aid.
- Pearson anticipates improved performance in the second half and maintains a stable medium-term outlook.
Pearson PLC (LSE: PSON), a global education leader, delivers digital learning content, assessments, certifications, and data-driven solutions across segments including Assessment & Qualifications, Virtual Learning, English Language Learning, Workforce Skills, and Higher Education.
In the financial year 2024 (FY24), the company’s revenue rose by 3.0% YoY to GBP 3,552.00 million, driven by an 8.0% surge in the English Learning segment, led by institutional demand and strong performance from the Pearson Test of English (PTE). Adjusted operating profit increased by 10.0% YoY to GBP 600.00 million, supported by higher revenue and improved cost efficiencies despite inflationary pressures. Meanwhile, profit for the year grew by 14.5% YoY to GBP 435.00 million, up from GBP 380.00 million in FY23, due to revenue growth and increased operating profit.
Recent Business Update
Pearson advanced its strategic priorities in FY24 by launching new learning tools, securing key contracts, including one with the UK Ministry of Defence, refreshing its brand, initiating a GBP 350 million share buyback, and recovering GBP 100 million in state aid.
Company Outlook
Pearson reaffirmed its FY25 guidance, expecting both sales growth and adjusted operating profit to align with market expectations, despite projecting low single-digit growth in H1FY25. The company anticipates improved performance in the second half and maintains a stable medium-term outlook.
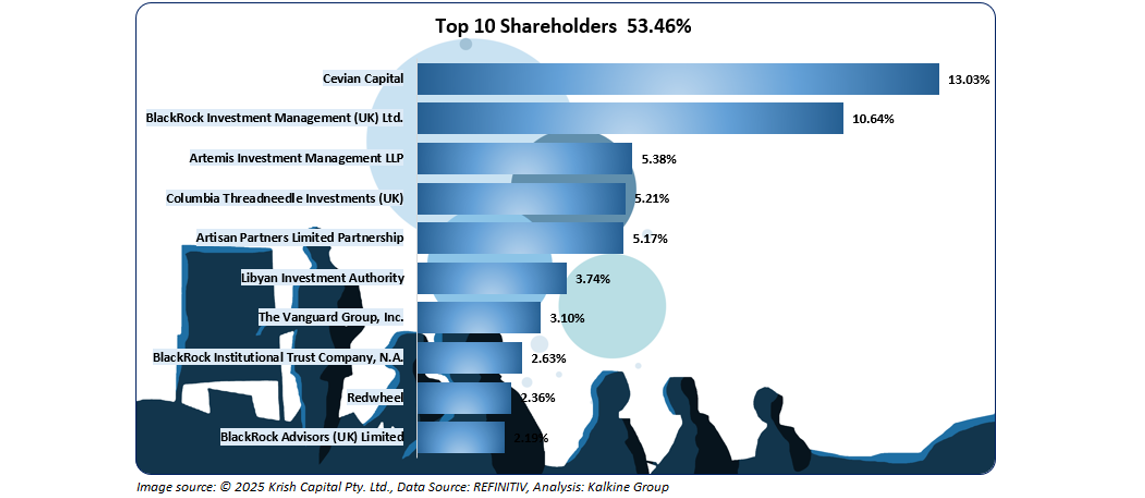
Top 10 Shareholders
The top 10 shareholders of Pearson collectively hold approximately 53.46% of the company’s total shares. Among them, Cevian Capital and BlackRock Investment Management have the largest stakes, owning around 13.03% and 10.64%, respectively.
Stock Information
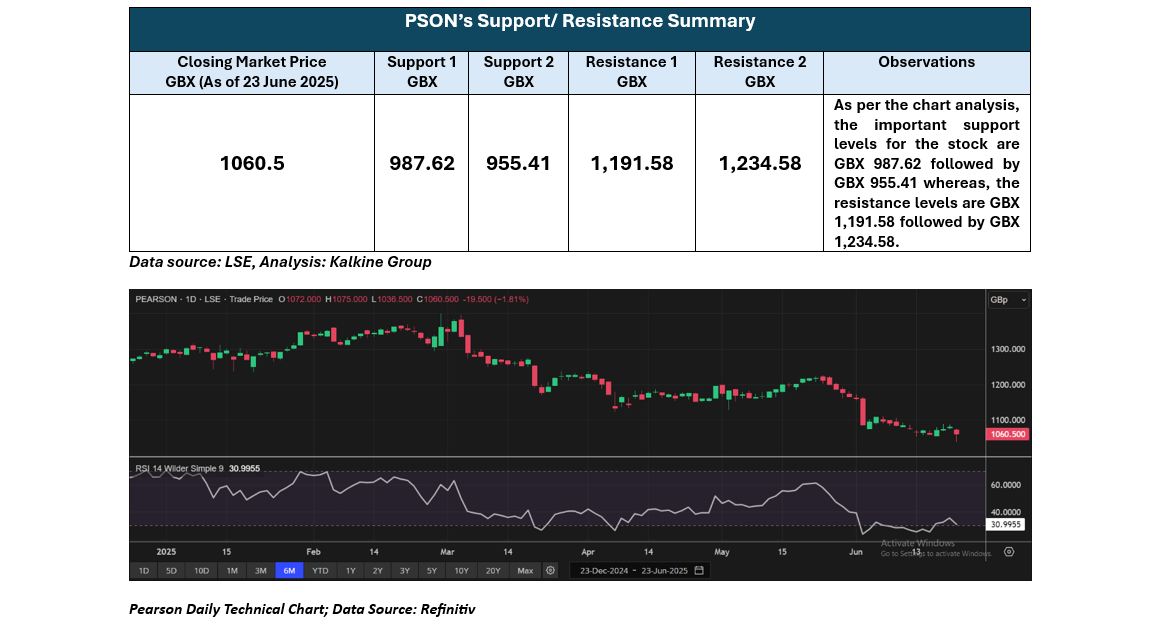
The stock has declined by approximately 0.88% over the past week and 12.49% over the past month. As of 23 June 2025, it closed at GBX 1,060.5, trading above its 52-week low of GBX 967.60 but below its 52-week high of GBX 1,401.00.
Note 1: Past performance is not a reliable indicator of future performance.
Note 2: The reference data for all price data, currency, technical indicators, support, and resistance levels is 23 June 2025. The reference data in this report has been partly sourced from EODHD/Others.
Technical Indicators Defined
Support: A level at which the stock prices tend to find support if they are falling, and a downtrend may take a pause backed by demand or buying interest. Support 1 refers to the nearby support level for the stock and if the price breaches the level, then Support 2 may act as the crucial support level for the stock.
Resistance: A level at which the stock prices tend to find resistance when they are rising, and an uptrend may take a pause due to profit booking or selling interest. Resistance 1 refers to the nearby resistance level for the stock and if the price surpasses the level, then Resistance 2 may act as the crucial resistance level for the stock.


 Please wait processing your request...