
Highlights
- Pebble Group’s H1FY25 revenue declined 3.6% year on year to GBP 58.60 million amid softer client spending
- Operating profit and post-tax profit fell 12.5% and 13.0% in H1, reflecting lower revenue and planned growth investments
- Cash distributions doubled year on year to GBP 5.2 million in H1
- Management expects FY25 performance to meet expectations, supported by anticipated H2 sales activity and stable margins
Pebble Group PLC (LSE:PEBB) is a UK-based holding company listed on the FTSE AIM All-Share Index. It primarily operates in the promotional merchandise industry, providing digital commerce solutions, products, and associated services.
For the first half of fiscal year 2025 (H1FY25), the company’s revenue was GBP 58.60 million compared with GBP 60.80 million in H1FY24, reflecting a year-on-year change of negative 3.6%. Operating profit was GBP 2.80 million versus GBP 3.20 million a year earlier, a change of negative 12.5%, and profit after taxation was GBP 2.00 million versus GBP 2.30 million, a change of negative 13.0%. Revenue declined due to softened existing client spend, partially offset by new contract wins, which planned sales and marketing investment, and softer client spend offset new contract revenue, and that lower revenue and planned growth investments offset margin gains and cost discipline.
Meanwhile, key positive metrics included a rise in net cash to GBP 6.0 million in H1 FY25 from GBP 4.9 million in H1 FY24, and a rise in cash distributions to GBP 5.2 million in H1 FY25 from GBP 2.6 million in H1 FY24.
Company Outlook
The company’s outlook indicates an expectation that FY25 results will meet expectations. The forecast is based on projected second-half sales activity at Brand Addition, which is anticipated to deliver full-year revenue consistent with FY24, supported by maintained gross margin run rates and controlled cost commitments. Management describes the outlook as decent for H2 FY25.
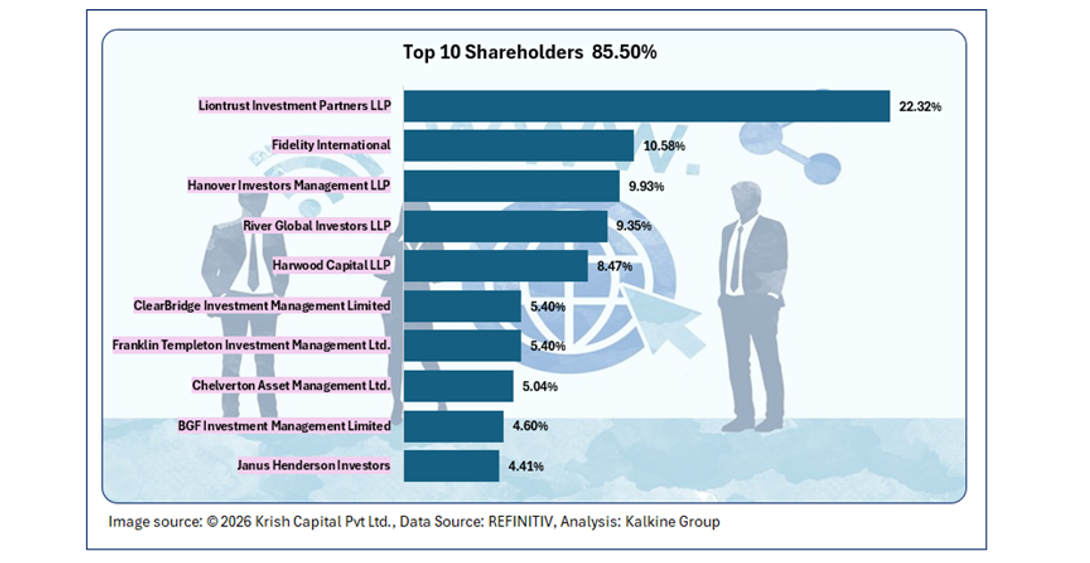
Top 10 Shareholders
The company’s share register is highly concentrated, with the top ten shareholders collectively accounting for around 85.50% of total ownership. Liontrust Investment Partners LLP is the largest shareholder with an approximate 22.32% stake, followed by Fidelity International holding about 10.58%.
Stock Information
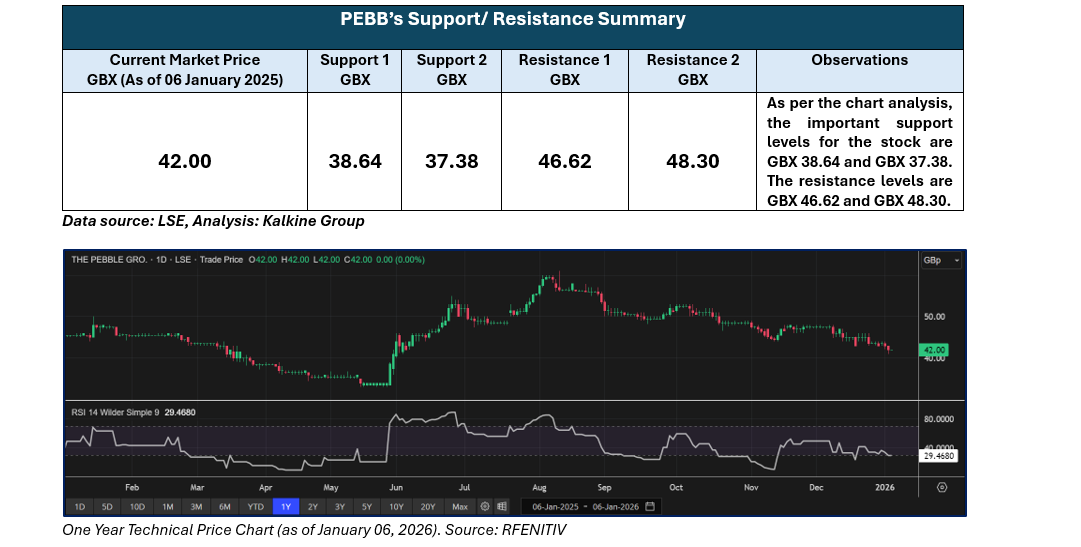
The stock declined 3.44% over one week and 19.99% over three months. The stock is trading below the average of the 52-week high price of GBX 61.00 and the 52-week low price of GBX 33.00.
 Note 1: Past performance is not a reliable indicator of future performance.
Note 2: The reference data for all price data, currency, technical indicators, support, and resistance levels is 06 January 2026. The reference data in this report has been partly sourced from EODHD/Others.
Technical Indicators Defined
Support: A level at which the stock prices tend to find support if they are falling, and a downtrend may take a pause backed by demand or buying interest. Support 1 refers to the nearby support level for the stock and if the price breaches the level, then Support 2 may act as the crucial support level for the stock.
Resistance: A level at which the stock prices tend to find resistance when they are rising, and an uptrend may take a pause due to profit booking or selling interest. Resistance 1 refers to the nearby resistance level for the stock and if the price surpasses the level, then Resistance 2 may act as the crucial resistance level for the stock.


 Please wait processing your request...