
Image source: Shutterstock
Highlights
- PEBB’s FY24 revenue increased by 0.9% YoY to GBP 125.30 million.
- The company’s adjusted EBITDA grew by 4.4% YoY to GBP 16.70 million during the period.
- PEBB expects improved cash conversion in FY25, supporting future growth and shareholder returns.
Pebble Group PLC (LSE: PEBB) is a UK-based FTSE AIM All Share holding company providing digital commerce, products, and services to the promotional merchandise industry through its Brand Addition and Facilisgroup segments.
In the financial year 2024 (FY24), the company’s revenue increased by 0.9% YoY to GBP 125.30 million, driven by incremental ARR from partner subscriptions for their technology and fees from preferred suppliers. The adjusted EBITDA grew by 4.4% YoY to GBP 16.70 million, primarily driven by performance in both segments and increased revenue. The profit for the year rose by 10.5% to GBP 6.30 million, supported by improved margins in the Brand Addition segment.
Company Outlook
The Pebble Group expects continued improvement in operating cash conversion in FY25, following gains seen in FY24. These cash flow gains are being allocated to support new business momentum, organic revenue growth from 2026, and shareholder value via dividends and selective buybacks.
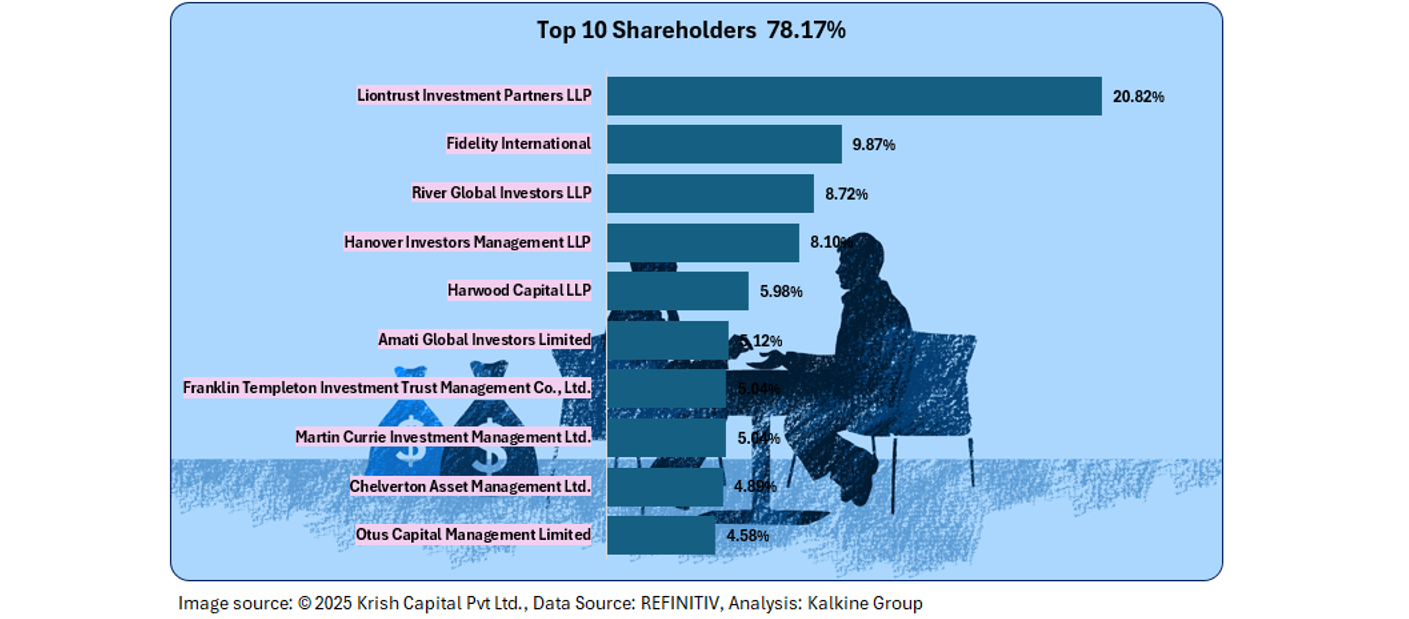
Top 10 Shareholders
The top 10 shareholders collectively hold ~78.17% of the total shares, with Liontrust Investment Partners LLP and Fidelity International holding around 20.82% and 9.87%, respectively.
Stock Information
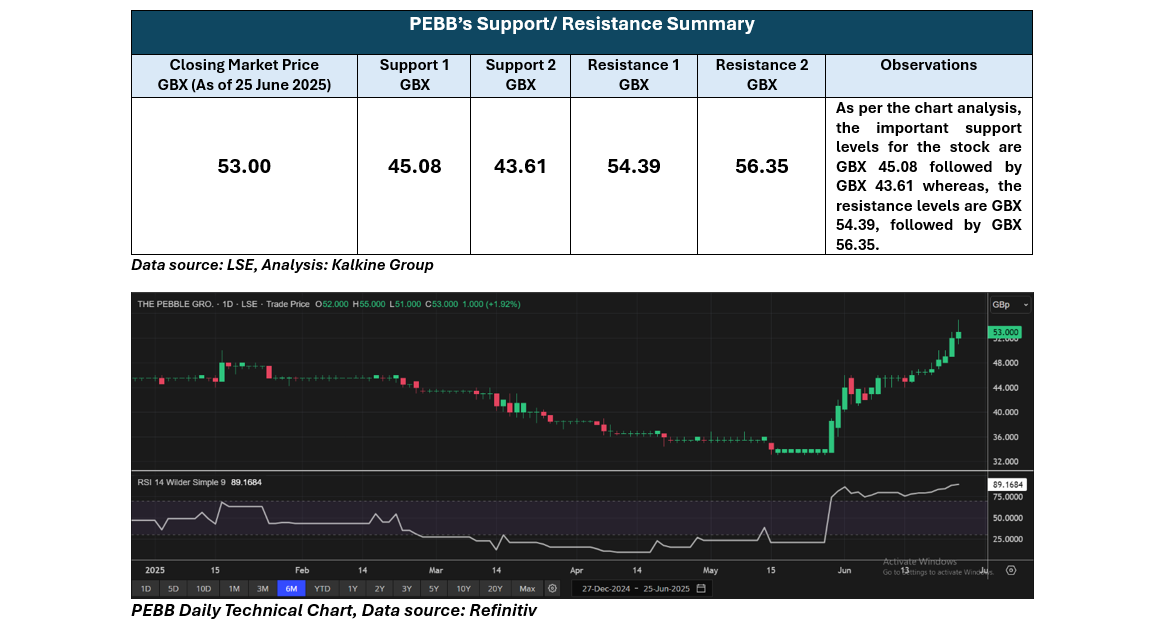
The stock has recorded a notable upside of approximately 55.88% over the past month and around 16.48% over the last six months. It has traded within a 52-week range of GBX 33 to GBX 62 and is currently positioned above the midpoint of this range, closing at GBX 53 as of 25 June 2025.
Note 1: Past performance is not a reliable indicator of future performance.
Note 2: The reference data for all price data, currency, technical indicators, support, and resistance levels is 25 June 2025. The reference data in this report has been partly sourced from EODHD/Others.
Technical Indicators Defined
Support: A level at which the stock prices tend to find support if they are falling, and a downtrend may take a pause backed by demand or buying interest. Support 1 refers to the nearby support level for the stock and if the price breaches the level, then Support 2 may act as the crucial support level for the stock.
Resistance: A level at which the stock prices tend to find resistance when they are rising, and an uptrend may take a pause due to profit booking or selling interest. Resistance 1 refers to the nearby resistance level for the stock and if the price surpasses the level, then Resistance 2 may act as the crucial resistance level for the stock


 Please wait processing your request...