
Image source: Shutterstock
Highlights
- RHIM’s FY24 revenue declined by 2.4% YoY, with net profit down 9.9% YoY.
- The company declared a final dividend of EUR 1.80 per share, paid on June 12, 2025.
- RHIM expects 35–40% of FY25 EBITA in H1, with 60–65% in H2 driven by deferred projects.
RHI Magnesita NV (LSE: RHIM) is engaged in the full refractory value chain, including mining, production, and distribution of high-quality materials for high-temperature industrial applications across steel, cement, non-ferrous metals, glass, energy, environmental, and chemical sectors.
In the financial year 2024 (FY24), the company’s revenue fell by 2.4% YoY to EUR 3,487.00 million impacted by a 6% pricing drop and 1% lower base volumes, partly offset by a 6% revenue lift from FY23 M&A. The profit after income tax fell by 9.9% YoY to EUR 154.00 million, backed by cost control, lower SG&A, a 23% tax rate, and a drop in net finance expenses from EUR 100 million to EUR 42 million. However, the adjusted EBITDA remained flat at EUR 543.00 million.
Business Updates
The company declared a final dividend of EUR 1.80 per share on February 27, 2025, which was subsequently paid to shareholders on 12 June, 2025.
In the first quarter of FY25 (Q1 FY25), RHIM completed an acquisition of EUR 391 million of Resco, enhancing domestic production capabilities in the U.S. and reducing reliance on imports.
Company Outlook
RHI Magnesita expects H1 FY25 to contribute only 35–40% of full-year adjusted EBITA, with 60–65% anticipated in H2, driven by deferred projects and pricing actions. Based on the current order book and Resco contribution, Adjusted EBITA could end modestly ahead of FY24.
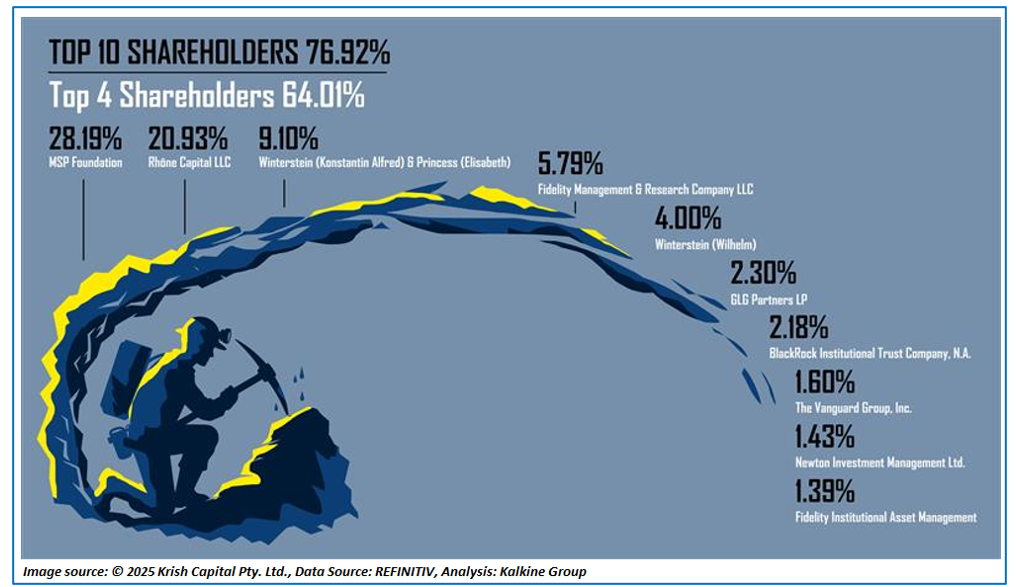
Top 10 Shareholders
The top 10 shareholders of RHIM collectively hold approximately 76.92% of the total shares, with MSP Foundation and Rhône Capital LLC holding the largest stakes at around 28.19% and
20.93%, respectively.
Stock Information
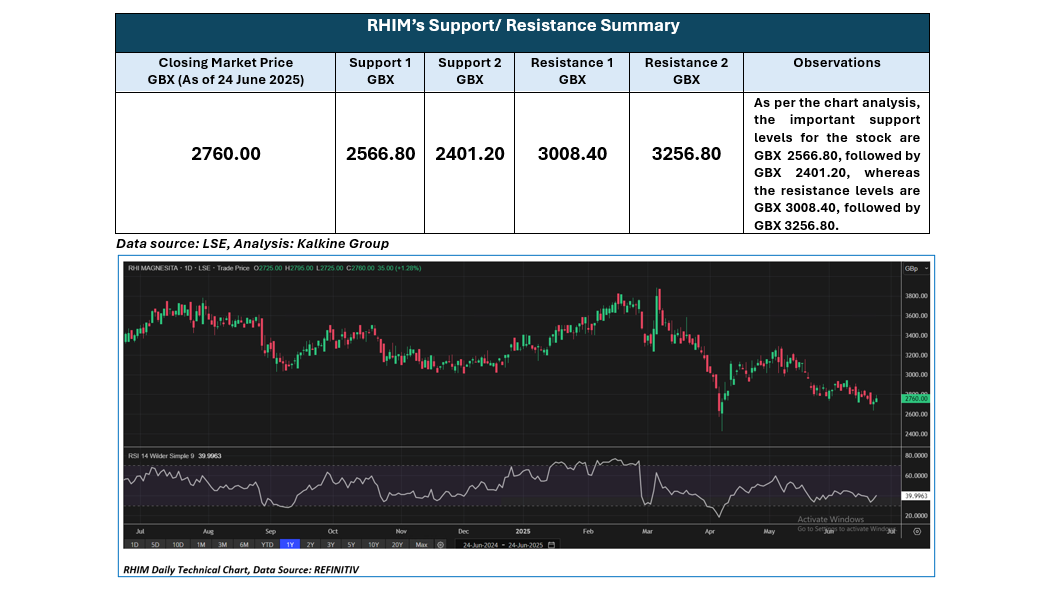
The stock price of RHIM has gone down by ~1.60% in the last month, and over the last six months, stock price has declined by ~16.49%. The stock has a 52-week low and 52-week high of GBX 2,425.00 and GBX 3,885.00, respectively, with a closing price of GBX 2760 as of 24 June 2025.
Note 1: Past performance is not a reliable indicator of future performance.
Note 2: The reference data for all price data, currency, technical indicators, support, and resistance levels is 24 June 2025. The reference data in this report has been partly sourced from EODHD/Others.
Technical Indicators Defined
Support: A level at which the stock prices tend to find support if they are falling, and a downtrend may take a pause backed by demand or buying interest. Support 1 refers to the nearby support level for the stock and if the price breaches the level, then Support 2 may act as the crucial support level for the stock.
Resistance: A level at which the stock prices tend to find resistance when they are rising, and an uptrend may take a pause due to profit booking or selling interest. Resistance 1 refers to the nearby resistance level for the stock and if the price surpasses the level, then Resistance 2 may act as the crucial resistance level for the stock


 Please wait processing your request...